

Analyze website requests
The Requests Analytics page shows the volume and HTTP response status of requests handled for your website.
Use this page to review successful and failed requests, identify redirects and errors, find frequently requested paths, and investigate unusual traffic patterns over time.
When to use
Use this page when you need to:
- Investigate a change in website traffic
- Identify frequently requested URLs
- Review increases in
404or server-error responses - Check whether redirects account for a significant share of requests
- Find the paths contributing most to failed requests
- Investigate unusual request spikes
- Compare current request activity with the previous equivalent period
- Export request data for your developer, team, or Pressidium Support
Access the Requests Analytics page
- Log in to the Pressidium Dashboard.
- Select the website you want to review.
- Select the correct environment.
- Go to Analytics.
- Open the Requests tab.
Sections Included
- Time range selector – changes the reporting period for all analytics on the page
- Request summary cards – show request totals, response categories, and percentage changes
- Response Breakdown – shows the proportion of requests in each HTTP response group
- Top URLs – lists the paths receiving the most requests
- Requests per hour bar chart – shows hourly request volume grouped by HTTP response type
- Requests per hour line chart – shows how each HTTP response group changes over time
Time range and data updates
At the top of the page, use the Show filter to change the reporting period.
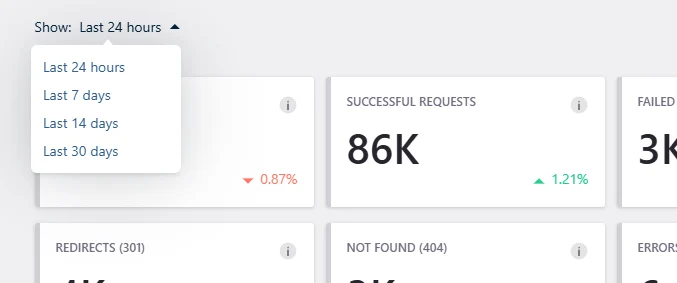
The page displays the time when the analytics data was last updated below the selected range.
All summary cards, charts, and tables update to reflect the selected period.
Request summary cards
The summary cards provide a high-level view of request activity for the selected period.
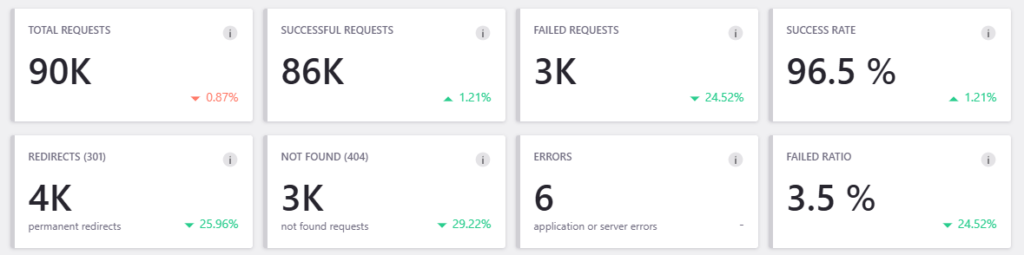
The percentage indicator on each card shows the change compared with the previous equivalent period.
- Total Requests: Shows the total number of requests recorded during the selected period.
Use this card to identify overall increases or decreases in traffic. - Successful Requests: Shows the requests classified as successful.
Successful requests normally include responses in the2xxHTTP status range. - Failed Requests: Shows requests classified as unsuccessful.
Use the response breakdown and Top URLs table to identify the HTTP response types and paths contributing to this total. - Success Rate: Shows the percentage of requests that completed successfully.
Review changes in this value alongside the total request count. A lower success rate during a traffic spike may require closer investigation. - Redirects (301): Shows requests that returned a permanent redirect response.
Some redirects are expected, such as redirects from an old URL to a replacement. A large or unexpected increase may indicate:- Outdated internal links
- Repeated redirect traffic
- Automated requests targeting old URLs
- A redirect configuration affecting many requests
- Not Found (404): Shows requests for URLs that returned a
404 Not Foundresponse.
Use the Top URLs table to identify frequently requested missing paths. - Errors: Shows requests that returned application or server-error responses.
Review these requests promptly, particularly when the count increases or the same paths appear repeatedly. - Failed Ratio: Shows the percentage of requests classified as failed.
Use this card with the Failed Requests, Not Found (404), and Errors cards to understand whether failed responses represent a meaningful share of overall traffic.
Response Breakdown
The Response Breakdown chart shows the proportion and total number of requests in each HTTP response group.
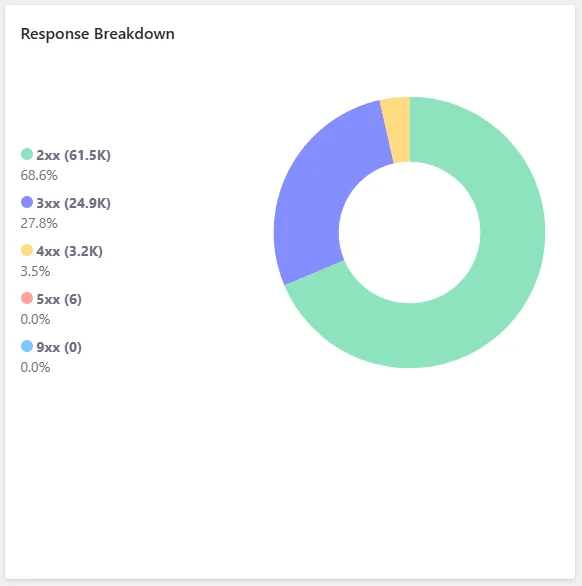
Common groups include:
- 2xx – successful responses
- 3xx – redirects
- 4xx – request or client-error responses, including
404 Not Found - 5xx – application or server-error responses
Use this chart to determine whether changes in total request volume are primarily successful requests, redirects, missing URLs, or errors.
A high number of requests in one group does not always indicate a problem. Review the affected paths and traffic pattern before taking action.
Top URLs
The Top URLs table lists the paths receiving the highest number of requests during the selected period.
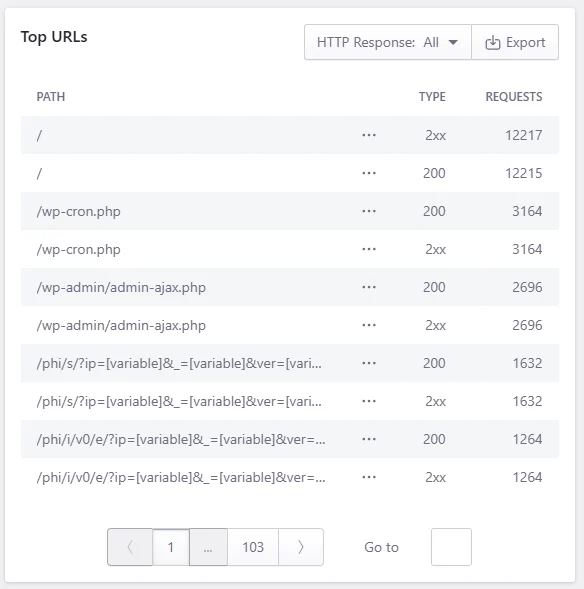
For each entry, the table shows:
- Path – the requested URL path
- Type – the HTTP response status or response group
- Requests – the number of recorded requests
The same path may appear more than once when it returns different HTTP response types.
For example, one entry may show the exact 200 response while another groups the path under the broader 2xx category.
Filter by HTTP response
Use the HTTP Response filter to limit the table to a particular response type or group.
This is useful when you need to focus on:
- Successful requests
- Redirected paths
- Missing URLs
- Failed requests
- Server or application errors
Clear the filter to return to the complete list.
Search and navigate the table
Use the pagination controls to review additional entries.
When the table contains many paths, move between pages or enter a page number to access a specific part of the results.
Export the table
Click Export to download the displayed data as a CSV file.
Export the results when you need to:
- Share affected paths with a developer
- Compare request data outside the Dashboard
- Attach supporting data to a support request
- Keep a record of traffic or error activity
Apply the required filter before exporting when you only need a specific response category.
Requests per hour bar chart
The hourly bar chart shows the total number of requests recorded during each hour.
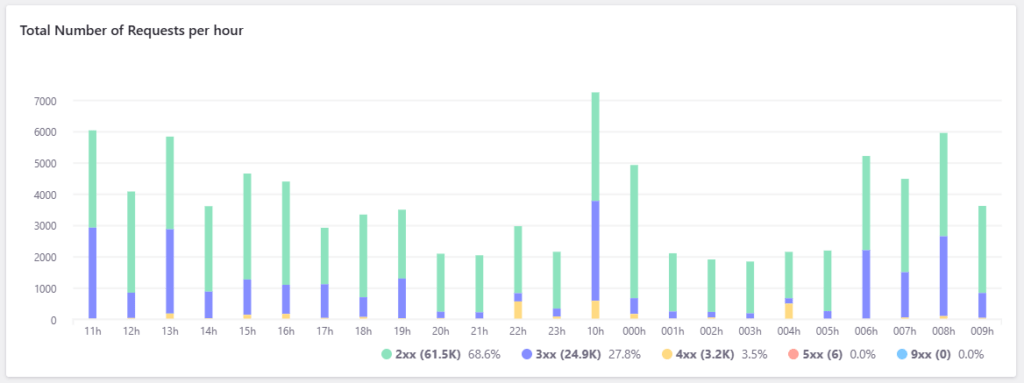
Each bar is divided by HTTP response group. This lets you compare successful requests, redirects, request errors, and server errors within the same period.
Hover over an hourly bar to view:
- The total number of requests
- The count for each response group
- The percentage represented by each group
Use this chart to identify:
- Traffic spikes
- Sudden increases in failed requests
- Hours with unusually high redirect activity
- Periods where errors increased alongside traffic
- Recurring activity at the same time each day
Requests per hour line chart
The hourly line chart shows how request volume changes over time for each HTTP response group.
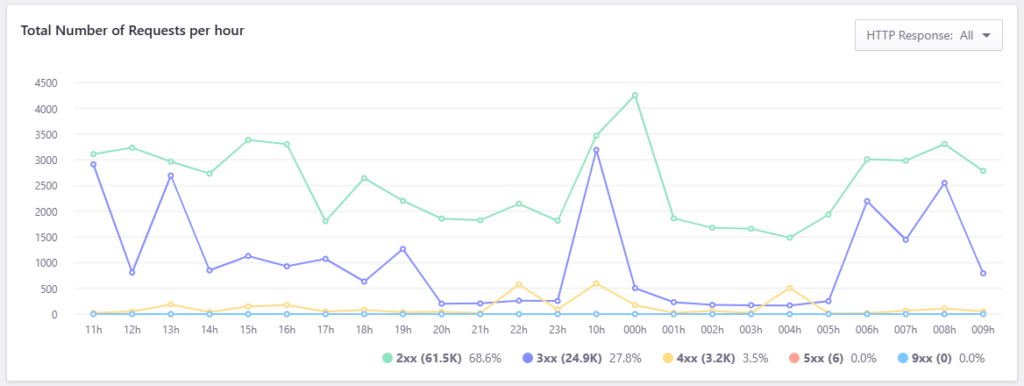
Use the HTTP Response filter to focus on one category or review all available response groups together.
The line view can make trends easier to compare when request categories overlap or change at different rates.
Use this chart to determine whether:
- A response category increased gradually
- An error spike was limited to one hour
- Redirect or not-found traffic follows a recurring pattern
- Successful traffic and failed traffic increased at the same time
Understanding the results
Use the summary cards, charts, and table together. A single metric rarely provides enough context by itself.
High total requests with a stable success rate
This may represent expected traffic growth, a campaign, automated requests, scheduled activity, or increased visitor demand.
Review the hourly charts and top paths to identify where the requests originated.
A lower success rate
Check whether the increase comes from:
404 Not Foundresponses- Application or server errors
- Redirect activity
- A specific frequently requested path
- A short traffic or bot spike
Filter the Top URLs table by the relevant response type.
A high number of redirects
Redirects may be expected, but repeated redirect traffic can add unnecessary requests.
Review the affected paths and check whether internal links still point to old URLs.
A high number of 404 responses
Some 404 traffic may come from bots or invalid external links.
Frequently requested missing paths may also indicate:
- Broken internal links
- Removed content that still receives traffic
- Incorrect asset references
- Old URLs without redirects
- Automated scans for files or endpoints
Application or server errors
Review recurring error paths and compare them with:
- Plugin or theme changes
- Deployments
- Traffic spikes
- Scheduled tasks
- WooCommerce or membership activity
- External API problems
Use application and error logs for request-level investigation.
Frequently requested dynamic WordPress paths
Paths such as the following can generate dynamic work:
/wp-cron.php
/wp-admin/admin-ajax.php
High request counts do not automatically indicate a problem. Review whether the activity is expected and whether it coincides with slower response times, failed requests, or increased infrastructure load.
Best practices
When reviewing request analytics:
- Confirm the correct website and environment before interpreting the data.
- Check the data-update timestamp.
- Use the same time range for before-and-after comparisons.
- Start with the summary cards, then review the breakdown and hourly charts.
- Filter the Top URLs table by the response category you are investigating.
- Review both the request count and response type for each path.
- Investigate repeated
404and error paths before isolated occurrences. - Compare spikes with recent deployments, campaigns, plugin changes, or scheduled activity.
- Export the table before making changes when you need a record of the original data.
- Use logs when you need individual request details.
Common questions
Does a high request count mean the website is under attack?
Not necessarily.
High request volume may come from legitimate visitors, bots, scheduled tasks, APIs, crawlers, campaigns, or repeated requests to static and dynamic resources.
Review the affected paths, HTTP response types, and hourly pattern before deciding whether the traffic is suspicious.
Why does the same path appear more than once?
The same path may return different response statuses or appear as both an exact response code and a broader HTTP response group.
Compare the Type column before treating the entries as duplicates.
Are all 404 responses a problem?
No. Bots and scanners frequently request paths that do not exist.
Prioritize 404 paths that:
- Receive many requests
- Should exist
- Are linked from your website
- Represent missing images, scripts, or stylesheets
- Affect important visitor journeys
Does a redirect count mean there is a redirect loop?
No. A normal redirect also contributes to the redirect count.
A redirect loop requires request-level investigation. Check the affected URL directly or review the access logs.
Why do the card values change after I change the time range?
All values are recalculated for the selected reporting period.
The percentage indicators also compare the selected period with its previous equivalent period.
Why does the chart show more requests than one table page?
The charts include all recorded request data for the selected period.
The table displays only the top paths and separates the results across multiple pages.
Common issues and solutions
Recent requests do not appear
Check the data-update timestamp below the time range selector.
Recent activity may not appear until the analytics data is refreshed.
The expected URL is missing from Top URLs
Check whether:
- The selected reporting period includes the request.
- An HTTP response filter is active.
- The path generated enough requests to appear among the top entries.
- The correct environment is selected.
- The URL appears under a different response type.
Clear the active filter and review additional table pages.
The failed-request count increased
Review the following cards and sections:
- Not Found (404)
- Errors
- Response Breakdown
- Top URLs
- The hourly charts
Filter the table by failed response types to identify the paths contributing to the increase.
A large number of 404 requests targets unfamiliar paths
The traffic may come from bots or automated scanners.
Review whether the paths are associated with legitimate content. Use access logs or security analytics to investigate the source of repeated unwanted requests.
Redirect requests increased unexpectedly
Check whether:
- A new redirect was added.
- Internal links still use an old URL.
- A domain or HTTPS redirect is being requested repeatedly.
- Bots are requesting outdated paths.
- A redirect chain has been introduced.
Test the affected URLs and update internal links where appropriate.
Error responses are limited to one hour
Review recent activity during that hour, including:
- Deployments
- Plugin or theme updates
- Traffic spikes
- Scheduled tasks
- External service problems
- WooCommerce, membership, or LMS activity
Use the access and error logs for the same timestamp.
Analytics data appears inconsistent
Confirm:
- The selected site and environment
- The reporting period
- The data-update timestamp
- Any active table or chart filters
Export the results and contact Support if the data still appears incorrect.
Need help?
Contact Support if:
- Failed requests or server errors remain elevated.
- You cannot identify the source of repeated error responses.
- The analytics data appears incomplete or incorrect.
- An important path receives unexpected redirects or
404responses. - You need help investigating an unusual request spike.
Include:
- The affected domain
- The selected environment
- The reporting time range
- The relevant hour or timestamp
- The affected paths
- The HTTP response types
- The expected behavior
- The actual behavior
- Screenshots of the cards, charts, or table
- The exported CSV file, when available
- Any recent website, plugin, theme, deployment, or traffic changes
Where to go next
- Review Performance Analytics to compare request activity with server response times and identify high-impact paths.
- Review Cache Analytics to determine whether frequently requested paths are served as cache hits, misses, or bypasses.
- Review Geo & IP Analytics to identify the countries and IP addresses generating the most requests.
- Review access and error logs when you need request-level or application-level details for a specific URL or timestamp.
- Manage Firewall access rules when repeated unwanted requests originate from a specific IP address or country.
- Identify cache behavior using HTTP headers to verify whether a specific response returns a cache
HIT,MISS, or bypass status. - Manage website caches to clear cached content or purge an affected URL when visitors continue to receive an outdated response.
Was this article helpful?