

MySQL slow query logs
The MySQL slow query logs page lets you review database queries recorded as slow for your website’s Production or Staging environment.
Use the page to inspect recent slow-query activity, search and highlight specific queries, and download log files for further investigation.
When to use
Use MySQL slow query logs when:
- Your WordPress site is experiencing slow database-driven requests
- You want to identify database queries associated with performance problems
- A plugin, theme, or custom code may be generating expensive queries
- You need query information for further troubleshooting or to share with a developer or Pressidium Support
- You want to compare database activity between Production and Staging
Access the MySQL Slow Logs page
- Open the website in the Pressidium Dashboard.
- Select Production or Staging.
- Go to Logs.
- Select MySQL Slow Logs.
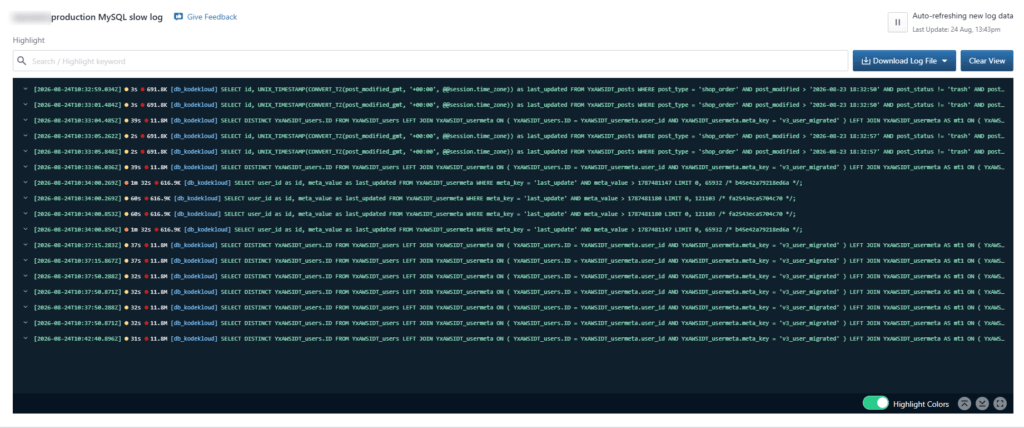
The page displays the slow log for the environment you selected.
Review slow-query entries
Each row in the log viewer represents a database query recorded in the MySQL slow log.

Entries include information such as:
- The timestamp
- Query metrics
- The database associated with the query
- The SQL statement
Query details
Click the arrow at the beginning of an entry to expand it and view the complete query details.
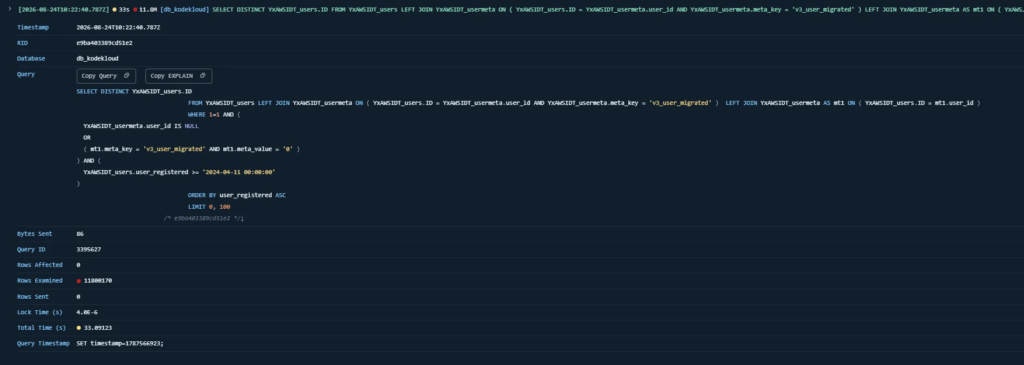
The expanded view can include:
- Timestamp – the date and time when the query was recorded
- RID – the request identifier associated with the log entry
- Database – the database against which the query ran
- Query – the complete SQL statement
- Bytes Sent – the amount of data sent for the query
- Query ID – the identifier assigned to the query
- Rows Affected – the number of rows affected by the query
- Rows Examined – the number of rows MySQL examined while processing the query
- Rows Sent – the number of rows returned
- Lock Time (s) – the time the query spent waiting for a database lock
- Total Time (s) – the total query execution time
- Query Timestamp – the MySQL timestamp associated with the query
The expanded Query section also provides:
- Copy Query – copies the SQL query so you can inspect or share it separately
- Copy EXPLAIN – copies an
EXPLAINversion of the query for further analysis
If you need to investigate a query further, use Copy Query or Copy EXPLAIN and provide the query details and timestamp to your developer or Pressidium Support.
Search and highlight log entries
Use Highlight when you need to find a particular query, table, plugin-related value, or other text in the displayed log.
- Click the Search / Highlight keyword field.
- Enter the text you want to find.
- Review the matching text highlighted in the log viewer.
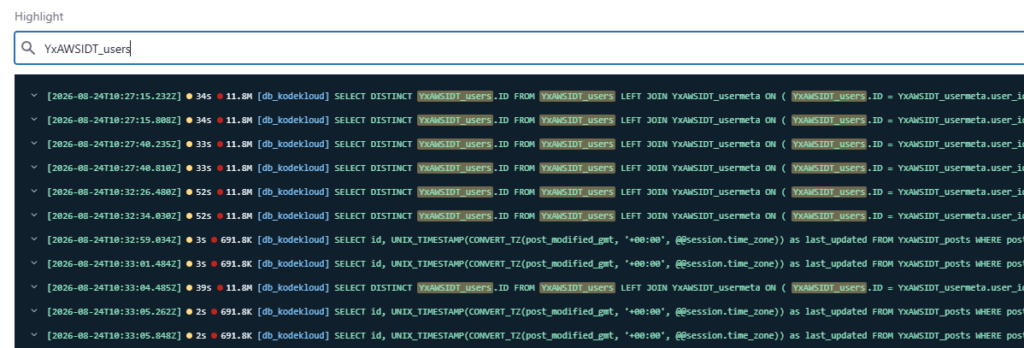
You can use the Highlight Colors toggle control at the bottom of the viewer to enable or disable colored highlighting.
Pause or resume automatic updates
To temporarily stop new entries from appearing, click the Pause control next to Auto-refreshing new log data.
Click it again when you want the viewer to resume receiving new log entries.
The Last Update value shows when the displayed data was most recently refreshed.
Download a log file
Use Download Log File when you want to inspect a log outside the Dashboard or retain it for troubleshooting.
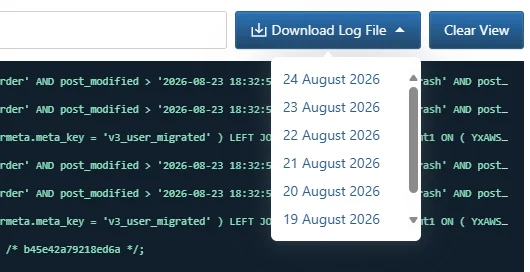
- Click Download Log File.
- Select an available date from the dropdown.
- Download the corresponding log file.
The dropdown lists the log dates currently available for download.
Clear the current view
Click Clear View to remove the entries currently displayed in the log viewer.
This is useful when you want to start with a clean viewer and observe new slow-query entries as they appear.
Common issues and solutions
The query I am looking for is not visible
First, confirm that you selected the correct Production or Staging environment.
You can then:
- Use Highlight to search for a table name, SQL fragment, or other identifiable text.
- Check whether automatic updates are paused.
- Use Download Log File to review an available log from an earlier date.
New entries are not appearing
Check whether automatic log updates are paused.
Resume auto-refresh and check the Last Update timestamp to confirm that the viewer is refreshing.
I need to investigate an older query
Open Download Log File and check the available dates. Download the relevant log file and search it for the timestamp, database, table, or SQL statement you are investigating.
Need help?
If you are investigating persistent database performance problems and cannot identify the source, contact Pressidium Support.
Include:
- The affected website
- Whether the issue occurs in Production or Staging
- The approximate date and timestamp of the issue
- The relevant slow-query entry or downloaded log file
- A screenshot if it helps demonstrate the problem
This information helps Support correlate the slow query with other website activity.
Where to go next
- Review Performance Analytics to investigate website performance over time.
- If your site is reporting database connectivity failures, follow Database connection errors.
- Before making manual database changes during troubleshooting, export a database backup.
Was this article helpful?