

Identifying Cache behavior using HTTP headers
To check whether page caching is active and to gain insights into the cache status of your site, you can inspect HTTP headers, such as the X-Cache header, using your browser’s developer tools or an HTTP client (such as curl).
Detect cache usage using browser Developer Tools
- Open Your Website: Launch your web browser and navigate to your WordPress website.
- Access Developer Tools:
- Google Chrome: Right-click anywhere on the page and select “Inspect” or press
Ctrl+Shift+I(orCmd+Option+Ion macOS) to open the Chrome DevTools. - Mozilla Firefox: Right-click anywhere on the page and select “Inspect Element” or press
Ctrl+Shift+I(orCmd+Option+Ion macOS) to open the Firefox Developer Tools.
- Google Chrome: Right-click anywhere on the page and select “Inspect” or press
- Navigate to the Network Tab: Within the Developer Tools, locate and click on the “Network” tab. This tab displays network activity, including HTTP requests and responses.
- Reload the Page: Click the browser’s refresh button or press
F5(orCmd+Ron macOS) to reload the page. - Inspect the HTTP Headers:
- After reloading the page, you’ll see a list of network requests in the Network tab.
- Locate the main request for your website (usually the first one in the list). It should be the URL of your website, such as
https://your-website.com. - Click on this request to view detailed information about it, including the HTTP headers.
- Look for the
X-CacheHeader: Scroll through the headers, and search for theX-Cacheheader in the “Response Headers” section.- If you see an
X-Cacheheader with a value like<strong>HIT</strong>, it indicates that the page was served from cache. This means that full page caching is active on your website and the page was retrieved from the cache instead of being generated dynamically. - If you see an
X-Cacheheader with a value like<strong>MISS</strong>, it indicates that the page was not served from cache. - In case the URL is excluded from the cache, an additional header
X-Cache-Whywill be present. For user specified exclusions this header will have the valueurl:bypass. - If you don’t find an
X-Cacheheader, ensure that your website is indeed served by Pressidium’s infrastructure by verifying that the DNS records point to the correct IPs. If you are using a reverse proxy setup or have setup an additional proxy or custom CDN ensure that their configuration is properly forwarding and handling origin HTTP headers.
- If you see an
Here’s an example of what the X-Cache header might look like in the Firefox Developer Tools:
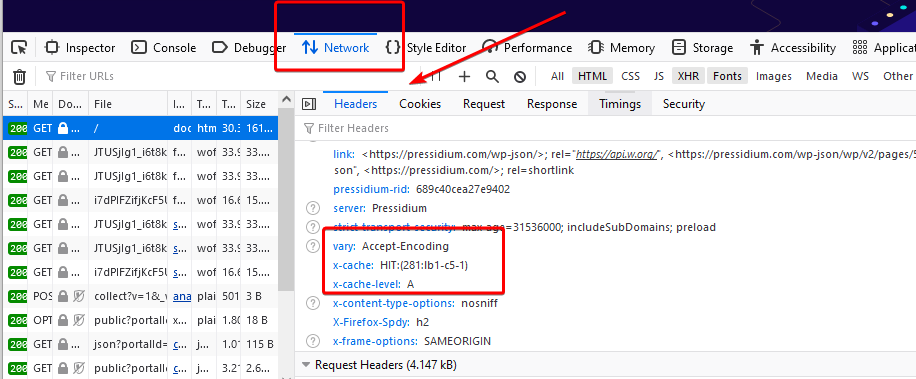
In this example, the X-Cache header indicates that the page was served from cache (HIT).
Detect cache usage using a command line HTTP client (e.g. curl)
You can also inspect HTTP headers and the X-Cache header using a command line HTTP client. A popular cross platform HTTP client is curl.
- Ensure that you have curl installed. Depending on your operating system the installation method might differ.
- Open your Terminal/Command Prompt: Launch the terminal or command prompt on your local machine.
- Use the
curlCommand: Enter the following command, replacingyour-website.comwith your WordPress website’s URL:
curl -I https://your-website.comThe -I option tells curl to fetch the HTTP headers of the specified URL.
Review the Output: After running the curl command, you’ll see a list of HTTP headers. Look for the X-Cache header, which can provide insights into the caching status.
- If you see an
X-Cacheheader with a value likeΗΙΤ, it means that the page was served from cache.
Here’s an example of what the curl output might look like:
HTTP/2 200
date: Tue, 26 Sep 2023 16:08:21 GMT
content-type: text/html; charset=UTF-8
content-length: 161431
x-cache-level: A
cache-control: must-revalidate, max-age=0
x-cache: HIT:(292:lb1-c5-1)
server: Pressidium
In this example, the X-Cache header shows that the page was served from cache (HIT).
Need help?
If the X-Cache header is missing, unclear, or does not match the cache behavior you expect, contact our Support team for guidance.
Where to go next
- Review how page cache works if you want to understand when pages are cached, bypassed, or regenerated.
- Clear your WordPress site cache if the page is still showing old content.
- Review persistent object cache if the issue may involve database-backed or dynamic content.
- Set up your domain and DNS records if the headers do not appear because the domain is not pointing to Pressidium.
Was this article helpful?