

Inspect access logs and request activity
The Access Logs page shows recent HTTP requests for a specific website served through Pressidium EDGE.
Use this screen when you want to:
- Check requests to a specific URL
- Review traffic to WordPress endpoints such as
/wp-login.phpor/wp-cron.php - Investigate repeated requests, unusual traffic, or bot activity
- Review response codes such as
200,301,403, or404 - Download logs for Support or internal troubleshooting
Open the Access Logs screen
- Log in to the Pressidium Dashboard.
- Go to Websites.
- Select the website you want to review.
- Click Logs.
You will now view Access Logs.
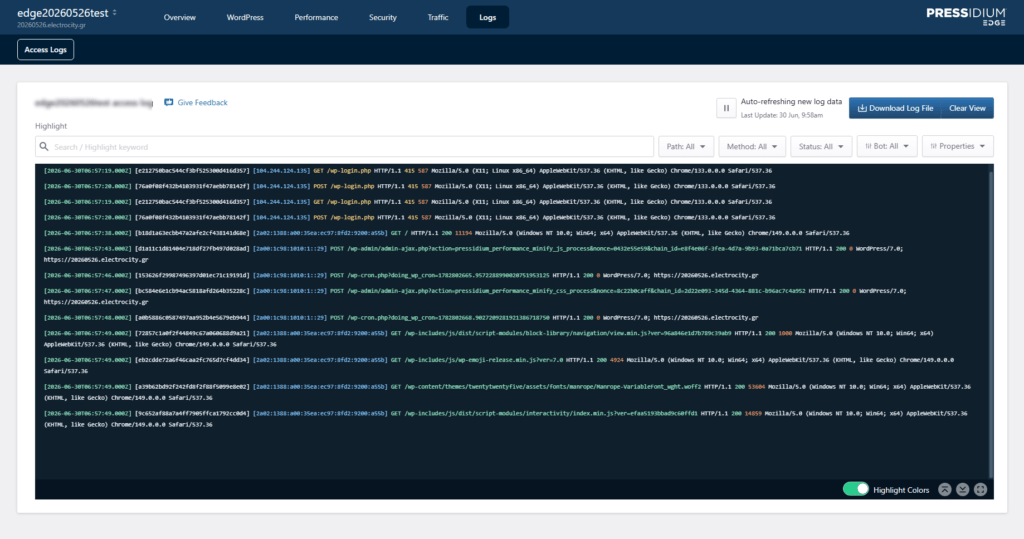
Sections included
- Log controls for auto-refresh, downloads, and clearing the current view
- Keyword search and highlighting
- Request filters
- Real-time access log stream
- Log viewer controls for highlighting, navigation, and fullscreen viewing
Log controls

Auto-refreshing log data
The page refreshes log data automatically when auto-refresh is enabled.
The Last Update timestamp shows when the log view was last refreshed.
Click the pause control to stop auto-refresh temporarily. This is useful when you need to inspect a specific set of entries without the view changing.
Download a log file
Click Download Log File to export the available access log data.
Use this when you need to:
- Share logs with Support
- Attach logs to an internal investigation
- Keep a local copy for review
- Compare traffic activity outside the dashboard
Clear the current view
Click Clear View to remove the currently displayed entries from the screen.
This does not delete stored logs. It only clears the visible output in your current dashboard session.
Keyword search and highlighting
Use the Search / Highlight keyword field to highlight specific values in the visible log output.

You can search for:
- A URL path
- An IP address
- A status code
- A request method
- A user agent keyword
- A WordPress endpoint, such as
/wp-login.php
The search field highlights matching values in the current log view. It does not apply a filter by itself.
Request filters

Filter by request path
Use Path to show requests for a specific path. Enter the full request path with a leading slash.
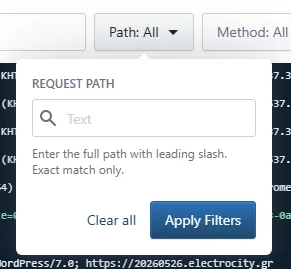
Example: /wp-login.php
Then click Apply Filters.
Click Clear all to remove the path filter.
Filter by HTTP request method
Use Method to filter requests by HTTP method.
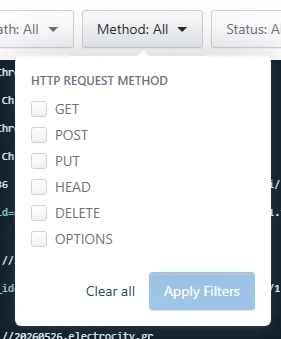
Available options include:
- GET
- POST
- PUT
- HEAD
- DELETE
- OPTIONS
Select one or more methods, then click Apply Filters.
Filter by HTTP response status
Use Status to filter requests by HTTP response code.
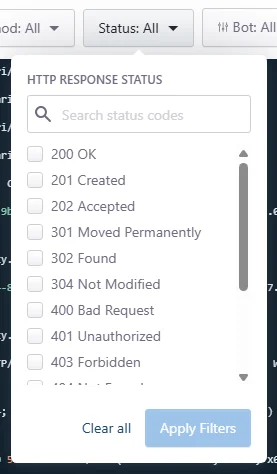
The list includes common status codes such as:
- 200 OK
- 201 Created
- 202 Accepted
- 301 Moved Permanently
- 302 Found
- 304 Not Modified
- 400 Bad Request
- 401 Unauthorized
- 403 Forbidden
- 404 Not Found
- 405 Method Not Allowed
- 429 Too Many Requests
- 500 Internal Server Error
- 503 Service Unavailable
- 504 Gateway Timeout
Use the search field inside the dropdown to find a specific status code faster.
Select one or more status codes, then click Apply Filters.
Click Clear all to remove the selected status filters.
Filter by bot traffic
Use Bot to filter log entries by traffic type.
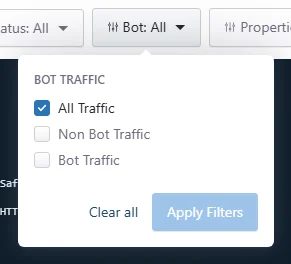
Available options include:
- All Traffic
- Non Bot Traffic
- Bot Traffic
Select the traffic type you want to review, then click Apply Filters.
Choose visible properties
Use Properties to control which fields appear in the log stream.
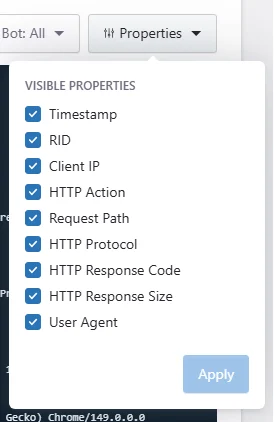
Available properties include:
- Timestamp
- RID
- Client IP
- HTTP Action
- Request Path
- HTTP Protocol
- HTTP Response Code
- HTTP Response Size
- User Agent
Select or deselect the properties you want to show, then click Apply.
This only changes what you see in the dashboard. It does not change the log data itself.
Real-time access log stream
The main log panel shows recent access log entries for the selected site. Each entry appears as a single line.

Depending on the selected visible properties, the line can show:
- Timestamp
- Request identifier
- Client IP address
- HTTP method
- Requested path
- Protocol
- Response status code
- Response size
- User agent
- Referrer, when available
You may see requests for normal WordPress paths, assets, admin actions, cron events, scripts, fonts, or plugin files.
Log viewer controls

Highlight colors
Use the Highlight Colors toggle to turn log highlighting on or off.
Highlight colors make the log stream easier to scan, especially when reviewing methods, paths, response codes, response sizes, and request metadata.
Common questions
Does Clear View delete my logs?
No. Clear View only clears the entries currently shown on your screen.
Can I pause the log stream?
Yes. Use the pause control next to the auto-refresh status.
Can I download access logs?
Yes. Click Download Log File.
Why does the path filter show no results?
The path filter requires the full path with a leading slash and uses exact matching only.
Use:
/wp-login.phpNot:
wp-loginWhy do I see requests to /wp-login.php or /wp-cron.php?
These are normal WordPress endpoints. Repeated or unusual patterns may indicate login attempts, cron activity, plugin activity, bot traffic, or other automated requests.
Common issues and solutions
The log stream keeps changing while I review entries
Pause auto-refresh before inspecting the log output.
I cannot find a specific request
Use filters and search together. For example, filter by Path, then search for an IP address, method, or response code.
The log output is too noisy
Use Path, Method, Status, Bot, and Properties to narrow the view.
I need Support to review a traffic issue
Download the log file and include the affected domain, approximate timestamp, request path, source IP if known, and a screenshot of the filtered log view.
Need help?
Contact Support if you are investigating suspicious traffic, repeated errors, or blocked legitimate requests.
Include:
- Site name
- Domain
- Approximate timestamp
- Affected URL or path
- Source IP, if known
- Downloaded log file
- Screenshot of the filtered log view
Where to go next
- Review Traffic at a Glance to understand request volume, response outcomes, and traffic patterns.
- Review Events Analytics if you are investigating blocked requests, WAF activity, or suspicious traffic.
Was this article helpful?