

Traffic at a glance
The Traffic at a Glance page gives you a summary of request activity, response outcomes, and traffic served by Pressidium EDGE.
To open it, go to Websites, click the site you want to manage and go to Traffic.
Use this page to review how much traffic your site receives, how much of that traffic is served on EDGE, and which URLs receive the most requests.
When to use this page
Use the Traffic at a Glance page when you want to:
- Review request volume
- Check how much traffic EDGE is serving
- Compare successful and failed requests
- Review redirects, 404s, and errors
- Understand cache handling by response type
- Identify high-traffic URLs
Sections included
- Requests Served on EDGE
- Data Served on EDGE
- Total Requests
- Successful Requests
- Failed Requests
- Success Rate
- Redirects
- Not Found (404)
- Errors
- Failed Ratio
- Response Breakdown
- Top URLs
Requests and data served on EDGE
Requests served on EDGE shows the share of total HTTP requests served from the EDGE network compared with requests forwarded to the origin.
Data served on EDGE shows the share of bandwidth delivered from the EDGE cache compared with bandwidth fetched from the origin.

Higher percentages mean EDGE is handling more traffic before it reaches your origin infrastructure. This can reduce origin load and bandwidth usage.
Request status
The request status metrics show total traffic volume and whether requests completed successfully during the selected period.

- Total requests shows the total number of inbound HTTP requests.
- Successful requests shows the number of requests that completed successfully.
- Failed requests shows the number of requests that did not complete successfully.
- Success rate shows the percentage of requests that completed successfully.
Use these metrics together to compare overall traffic volume against successful and failed request outcomes.
Request Breakdown

- Redirects shows permanent redirects for the selected period.
Use this metric to review redirect activity and confirm that redirect behavior matches your site configuration. - Not Found (404) shows requests that returned a not found response.
Use this metric to identify missing pages, broken links, or outdated URLs. - Errors shows application or server errors for the selected period.
Use this metric to identify possible origin, application, or infrastructure issues. - Failed Ratio compares failed requests against successful requests.
Use this metric to understand the proportion of failed traffic during the selected period.
Response Breakdown
The Response Breakdown chart shows how your website’s responses are distributed across HTTP status codes during the selected period.
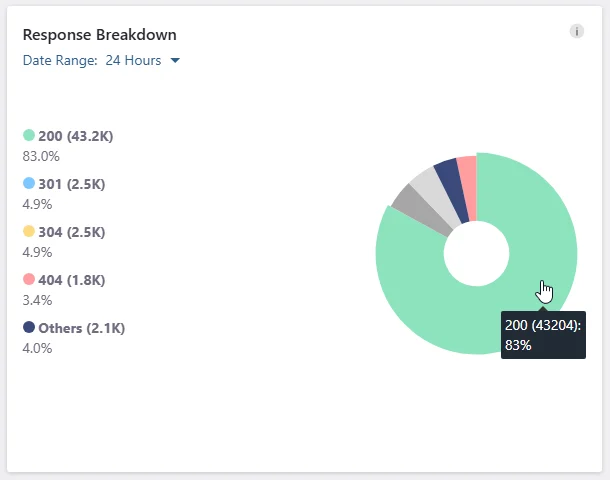
For each response type, the panel shows:
- The total number of requests
- The percentage of all responses
- Its relative share in the chart
Use this chart to quickly review how much traffic was served from cache, how much reached the origin, and how much intentionally bypassed cache.
The chart shows:
- 200 – successful responses
- 301 – permanent redirects
- 304 – responses where the requested resource has not changed
- 404 – requests for pages or resources that were not found
- Others – all remaining response codes grouped together
Use the Date Range selector to change the reporting period.
Top URLs
The Top URLs table shows the most frequently requested paths during the selected period.
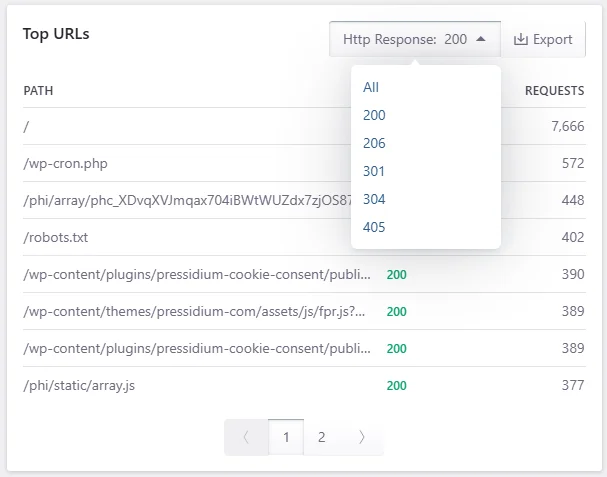
Use this table to identify high-traffic pages and resources, review the response returned for each path, and investigate URLs associated with redirects or unexpected response codes.
Use the HTTP Response filter to narrow the table by response code:
- All – shows all listed paths
- 200 – shows successful requests
- 206 – shows partial-content responses
- 301 – shows permanent redirects
- 304 – shows responses where the requested resource has not changed
- 405 – shows requests made with an unsupported HTTP method
The available filter values may vary depending on the response codes recorded during the selected period.
Click Export to download the table data as a CSV file.
A high request count does not always indicate a problem. Frequently requested entries may include:
- The website homepage
- WordPress scheduled-task requests such as
/wp-cron.php - JavaScript, CSS, images, and other static assets
- API or plugin endpoints
- Automated crawler or monitoring requests
Need help?
If traffic values appear incorrect, or if failed requests or errors increase unexpectedly, contact Support and include:
- Site name and domain
- Selected date range
- Screenshot of the Traffic at a Glance page
- Affected URL, response code, or error pattern
- Any recent DNS, cache, redirect, firewall, plugin, theme, or origin changes
Where to go next
After reviewing Traffic at a glance, use the related pages to investigate request activity in more detail.
- Open Traffic analytics for deeper request trends and traffic breakdowns.
- Compare traffic volume with cache behavior in Cache analytics.
- Check response timing and delivery metrics from Performance overview.
- Review blocked or suspicious requests in Events analytics.
- Inspect recent request details from Access logs.
- Troubleshoot unusual traffic-related loading issues with Site loading slowly.
Was this article helpful?