

Performance at a Glance
The Performance at a glance page gives you a summary of your WordPress site’s delivery performance through Pressidium EDGE.
Use this page to review response times, request volume, cache behavior, Core Web Vitals, and recent site audit results before opening more detailed reports.
What this page does
The page brings together the main performance and caching indicators for the selected site and date range.
It also provides shortcuts to detailed analytics, cache controls, site audit reports, documentation, and Support.
When to use
Use this page when you want to:
- Check the general performance state of a site
- Compare cached and origin response times
- Review request volume
- See how EDGE handled incoming requests
- Review recent Core Web Vitals and site audit results
- Decide which detailed report to open next
Access the Performance at a Glance page
- Log in to the Pressidium Dashboard.
- Go to Websites.
- Select the site you want to review.
- Go to Performance > At a Glance.
Use the Date Range selector to review data for a different period when this control is available.
Sections included
- Performance
- Quick Actions
- Caching KPIs
- Core Web Vitals
Performance
The Performance card summarizes response time and request activity for the selected date range.
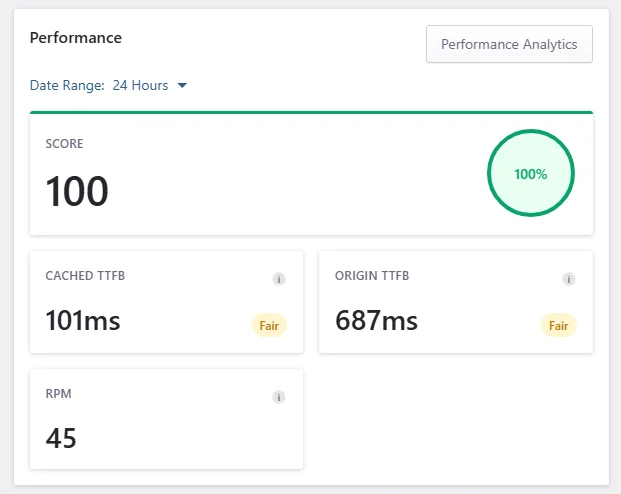
Click Performance Analytics to open a more detailed performance report.
Score
The Score provides a high-level summary of the available performance data.
The score appears after the Dashboard has collected and analyzed enough information for the site. Until then, the card displays Score not available yet.
Use the underlying response time, request, and cache metrics when investigating a specific issue rather than relying on the score alone.
Cached TTFB
Cached TTFB shows the Time to First Byte for requests served from EDGE cache.
Lower values indicate that cached responses are reaching visitors quickly without requiring the origin to generate the response.
Origin TTFB
Origin TTFB shows the Time to First Byte for requests that reached the origin infrastructure.
A high value can indicate that the origin is taking longer to process uncached or dynamic requests. Possible factors include WordPress processing, plugin behavior, database activity, hosting resources, or increased origin traffic.
RPM
RPM shows the site’s request rate in requests per minute.
Use this metric to identify changes in request volume and periods of increased traffic. A high RPM does not necessarily indicate poor performance. Compare it with cache behavior, Cached TTFB, and Origin TTFB to understand its effect on delivery.
Quick Actions
The Quick Actions card provides links to performance guidance and Support.
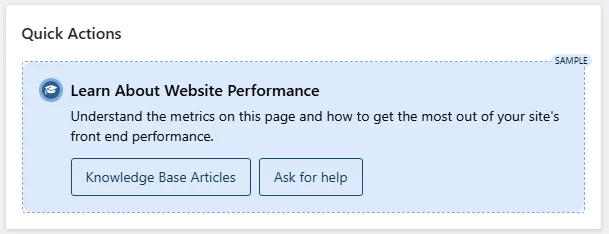
The card includes:
- Knowledge Base Articles
- Ask for help
Caching KPIs
The Caching KPIs card shows how EDGE handled requests during the selected date range.
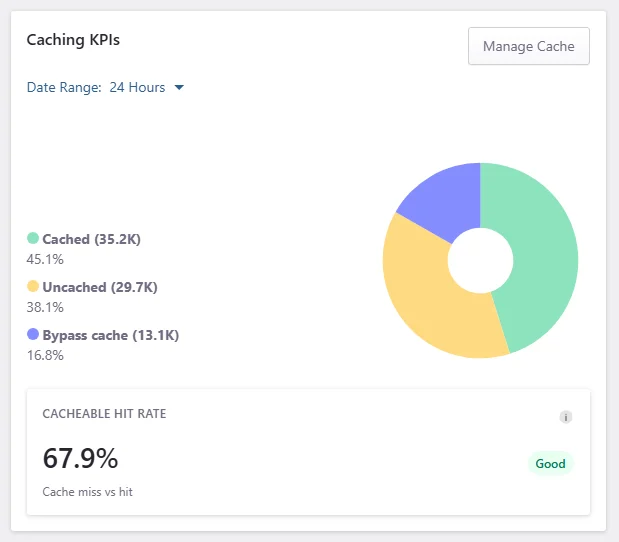
Click Manage Cache to open the site’s cache controls.
Cached
Cached requests were served from EDGE cache.
A higher cached percentage generally means that EDGE is serving more requests without forwarding them to the origin.
Uncached
Uncached requests were not served from cache.
This can happen when:
- Content has not been cached yet
- The response is not cacheable
- A URL, cookie, query parameter, or session affects cache behavior
- The request requires dynamic processing by the origin
Bypass cache
Bypass cache requests intentionally skipped cache.
This can happen because of:
- Cache bypass rules
- Logged-in sessions
- WordPress administration traffic
- Request cookies
- URLs or request types that require a fresh origin response
Cacheable Hit Rate
Cacheable Hit Rate shows the percentage of cache-eligible requests that were served from cache.
Use this metric to evaluate how effectively EDGE is handling traffic that can be cached.
Core Web Vitals
The Core Web Vitals card summarizes the latest available site audit results.
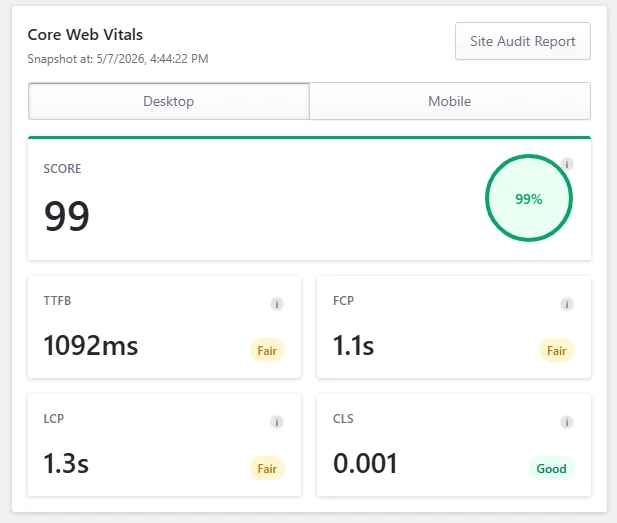
Switch between Desktop and Mobile to review results for each device type.
Depending on the available audit data, the card can show:
- CWV Score, which summarizes Core Web Vitals performance
- TTFB, which is a related response-time signal
- Accessibility Issues, which shows issues detected during the audit
TTFB can influence the loading experience, but it is not itself one of the Core Web Vitals.
Click Site Audit Report to review the complete audit and its recommendations.
If no site audits are available, the card displays No Site Audits yet. Run a site audit before expecting Core Web Vitals results to appear.
Best Practices
Review related metrics together
Do not evaluate a metric in isolation.
For example, a high RPM may be expected during a campaign when cache efficiency remains high. The same request volume may require investigation when most requests are uncached and Origin TTFB is increasing.
Compare consistent date ranges
Use comparable date ranges when reviewing performance before and after a change.
Allow the site to receive enough traffic before evaluating changes to caching, DNS, plugins, themes, or origin infrastructure.
Use the appropriate detailed report
- Open Performance Analytics to investigate response-time trends.
- Open Cache Analytics to investigate cache hits, misses, and bypasses.
- Open Traffic Analytics to investigate request volume and traffic spikes.
- Open Site Audit to investigate Core Web Vitals and front-end page issues.
Common issues and solutions
Score is not available
Symptom: The Performance card displays Score not available yet.
Likely cause: The Dashboard has not collected and analyzed enough performance data for the selected site and date range.
Resolution:
- Confirm that the domain is active and receiving traffic through EDGE.
- Select a date range that includes recent site activity.
- Return to the page after more performance data has been collected.
Verification: The Performance card displays a score instead of the empty-state message.
If the site is receiving traffic but the score remains unavailable, contact Support with the domain, selected date range, and a screenshot.
Cached TTFB is low, but Origin TTFB is high
This means EDGE is serving cached requests quickly, but the origin is taking longer to generate uncached responses.
Review:
- Slow dynamic URLs
- WordPress plugin and theme behavior
- Database activity
- Hosting resource usage
- Cache exclusions
- Requests that must bypass cache
Use Performance Analytics to identify when origin response time increased and Cache Analytics to see how much traffic reached the origin.
Cached percentage is lower than expected
A lower cached percentage can mean that many requests are uncached or intentionally bypassing cache.
Review:
- Cache exclusions
- Logged-in traffic
- Cookies and sessions
- Query parameters
- Dynamic URLs
- WordPress administration and API traffic
Use Cache Analytics to determine whether requests are uncached or bypassing cache before changing cache configuration.
RPM is high
A high RPM means that the site is receiving an elevated number of requests.
The increase may be expected during a campaign, sale, content launch, or other traffic event. It can also be caused by bots, repeated requests, API activity, or high-request paths.
Open Traffic Analytics to identify where the requests are going. Then compare the increase with cache behavior and Origin TTFB to determine whether it is affecting performance.
No Core Web Vitals results are available
Symptom: The Core Web Vitals card displays No Site Audits yet.
Resolution:
- Open Site Audit Report.
- Run an audit for the URL you want to evaluate.
- Wait for the audit to complete.
- Return to Performance > At a Glance.
Verification: Audit results appear under the appropriate Desktop or Mobile tab.
Need help?
- Performance metrics appear incorrect
- Metrics remain unavailable despite active traffic
- Traffic is not being cached as expected
- Origin TTFB remains high after reviewing origin behavior
- Cache changes do not appear in the Dashboard
- Core Web Vitals results appear incomplete or unexpected
- You need help interpreting the performance data
Include:
- Site name
- Domain
- Selected date range
- Approximate timestamp of the issue
- Screenshot of the Performance at a glance page
- Any recent DNS, cache, plugin, theme, code, or origin changes
Where to go next
- Open Performance Analytics to investigate response-time and performance trends.
- Use Cache Analytics to review cache hits, misses, bypasses, and cache efficiency.
- Open Traffic Analytics to investigate request volume and traffic patterns.
- Use Cache management to purge cached content or adjust cache behavior.
- Run or review a Site audit to evaluate Core Web Vitals and front-end performance.
- Diagnose continuing performance issues with Site loading slowly.
Was this article helpful?