

Analyze cache performance and cache status
Website analytics allow you to inspect and review request traffic information captured directly from our backend servers without requiring you to install a client-side Javascript solution.
Access Analytics for a website
- Log in to the Pressidium Dashboard.
- Select the site you want to manage.
- Go to Performance -> Cache Analytics.
Sections included
- Time range selector: Changes the reporting period for all cache analytics on the page.
- Cache summary cards: Show cached requests, uncached requests, cache hit rate, and cacheable hit rate.
- Cache Status Breakdown: Shows the share of requests served as hits, misses, or bypasses.
- Top URLs: Lists the most requested paths and their cache status.
- Cache Status Breakdown Over Time: Shows how hits, misses, and bypasses changed during the selected time range.
Cache summary cards
The summary cards show the main cache totals for the selected time period.

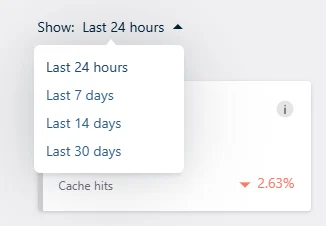
Use the Show filter to change the reporting period.
You can select:
- Last 24 hours
- Last 7 days
- Last 14 days
- Last 30 days
The cards include:
- Cached requests: The total number of requests served from the EDGE cache.
- Uncached requests: The total number of requests not served from cache. This includes cache misses and requests that bypass cache.
- Cache hit rate: The percentage of cached requests compared to all requests, including requests that bypass cache.
- Cacheable hit rate: The percentage of cached requests compared to all cacheable requests.
A higher hit rate means more requests are being handled at the edge instead of reaching your origin.
Cache status breakdown
The Cache Status Breakdown chart shows how requests were classified during the selected period.
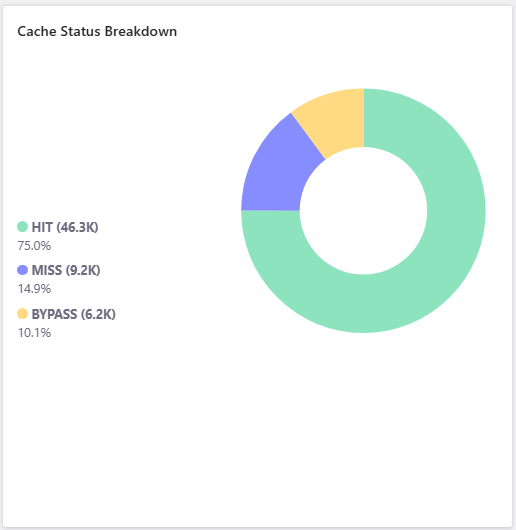
The statuses include:
- Hit: The request was served from the EDGE cache.
- Miss: The request was not served from cache, but may be cached for future requests.
- Bypass: The request was intentionally not cached.
Use this chart to quickly see whether most traffic is being served from cache or reaching your origin.
What is a Cache HIT / MISS / BYPASS
- A cache HIT is an HTTP request served by our Multilayer Adaptive Caching engine.
- A cache MISS is a potentially cacheable request that was not served by the caching layer but directly from the application or web servers. The first time a resource (dynamic or static) is requested it will result in a cache MISS. Subsequent requests for this resource will be served from the cache.
- A cache BYPASS is a request that is not considered for caching based on a set of criteria. Common requests that completely, by default, bypass the cache are HTTP POST requests.
Top URLs
The Top URLs table shows the most requested paths for the selected period.
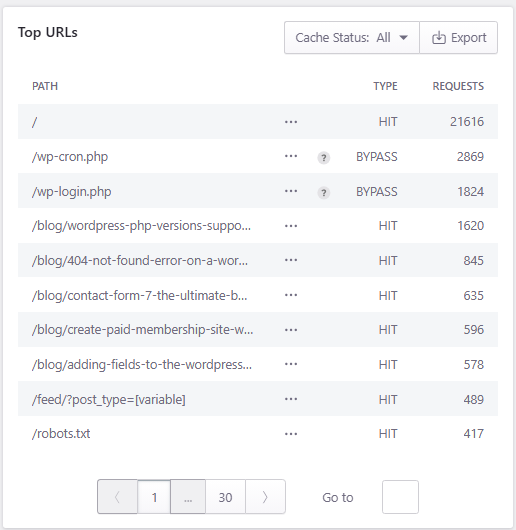
For each URL, the table shows:
- Path: The requested URL path.
- Type: The cache status for that path.
- Requests: The number of requests recorded.
Use the Cache Status filter to view all requests or focus on a specific cache status.
You can filter by:
- All
- Hit
- Miss
- Bypass
Some rows may include an information icon next to the path. This indicates a WordPress admin or related non-cacheable URL.
Export the table data
Click Export to download the table data in CSV format for further analysis or post processing. Clicking the “Export” button will trigger a browser file download with the requested data exported as a plain text CSV (comma separated) file.
The generated CSV files include a data header in the first line / row.
For each data table the exported data reflect the “current” filtered view. i.e. the export includes only the data visible in the applied filtered view and not the entire dataset. This way you can export one or more data views (or the entire unfiltered data set) as separate files.
Cache Status Breakdown Over Time
The Cache Status Breakdown Over Time chart shows cache behavior across the selected period.
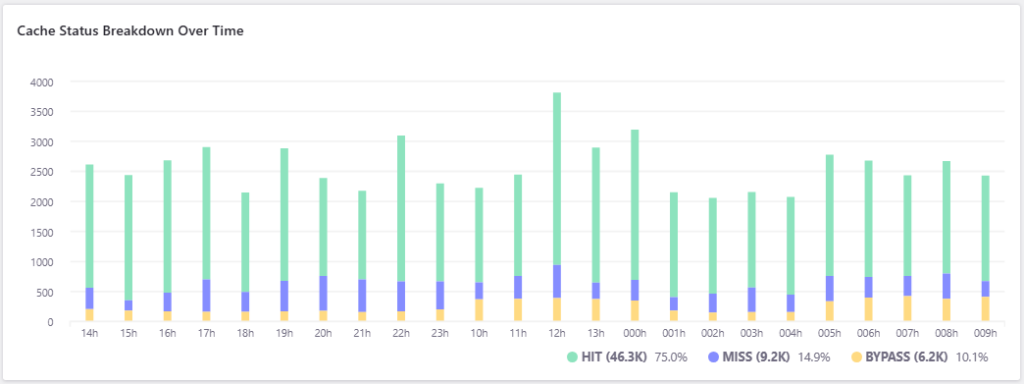
Use this chart to identify changes in cache activity, traffic spikes, or periods where more requests bypassed cache.
A sudden increase in misses or bypassed requests may indicate a configuration change, a traffic pattern change, or dynamic content that is not eligible for caching.
Understanding the results
Use Cache Analytics as a starting point for cache review, not as a pass/fail score.
A healthy cache profile depends on the type of WordPress site you run. A mostly public content site usually has a higher cache hit rate. A WooCommerce, membership, LMS, or logged-in user site may have more bypassed requests because more traffic depends on sessions, carts, accounts, or personalized content.
Expected bypasses include requests for WordPress admin, login, cron, checkout, account pages, and other dynamic paths.
If you see more misses or bypasses than expected, review your cache rules, URL exclusions, cookies, and dynamic pages before making changes.
Note: Cache analytics help you understand cache behavior. They do not replace application-level performance monitoring for uncached WordPress requests.
Best practices
Review the same time range when comparing before-and-after cache behavior.
Use Cache hit rate and Cacheable hit rate together. Cache hit rate includes all requests, while cacheable hit rate focuses on requests that are eligible for caching.
Check Top URLs before changing cache rules. This helps you identify whether high-traffic paths are expected to be cached, missed, or bypassed.
Expect some bypassed traffic on dynamic WordPress sites. Login, admin, cart, checkout, account, search, and personalized pages should not always be cached.
Investigate sudden changes in misses or bypasses after plugin updates, theme changes, cache rule changes, deployments, or traffic spikes.
Export the Top URLs table when you need to share cache behavior data with a developer, client, or Support.
Common questions
Where does the data come from?
Our primary data source is the raw access logs from our front-end/edge nodes.
How often are the data updated?
Analytics data are updated every hour, for hourly analytics, and at the end of each day for daily analytics. There might be an initial delay of up to 1 hour until data are available for new websites. The last update time is visible at the top left corner of each page.
What date/time ranges are supported?
We provide server side analytics for the following date ranges (might vary depending on the type of Analytics):
- Last 24 hours
- Last 7 days (week)
- Last 14 days
- Last 30 days (month)
You can select the desired range using the Show dropdown at the top left corner of each page.
What does the [variable] query string in Top URLs / Top Paths entries stand for?
We normalize HTTP requests based on HTTP response code and query string names and group them into a single entry. So GET requests to /myblog?version=1 and /myblog?version=2 will be displayed as /myblog/version=[variable] with an aggregated request count.
Is there a way to review why a Path / URL is bypassing the cache?
Yes, by hovering over the info icon (?) on the related entry you can inspect the reason the URL is bypassing Pressidium cache.

Common reasons include:
| Logged In Cookie Detected | The request includes a WordPress user logged-in cookie (active user login session). |
| HTTP POST Request | Responses to HTTP POST requests are by default not cacheable. |
| 302 HTTP Redirect | HTTP response that results in an HTTP redirect. |
| 301 HTTP Redirect | HTTP response that results in a HTTP redirect. |
| XMLHttpRequest (XHR) / AJAX request | AJAX request (https://developer.mozilla.org/en-US/docs/Web/Guide/AJAX/Getting_Started) |
| Non cacheable large file request | Response is a static asset with large file size and should not be cached. |
| Non cacheable URL | URLs such as wp-cron.php (related to WordPress scheduled jobs/cron system), wp-login.php (related to WordPress login flow) and WordPress admin related. |
| Non cacheable e-shop related URL | The request is part of an e-shop related non cacheable flow (e.g. WooCommerce cart update). |
| Customer defined cache exclusion URL | A URL that has been specifically excluded from cache either by the customer or the Pressidium support team. |
| Pressidium Request | Pressidium platform specific URLs. |
Can I see / filter analytics data based on custom date and/or time range?
This is not currently possible.
Need help?
Contact Support if cache analytics data looks incorrect, cache behavior changed unexpectedly, or you need help interpreting hit, miss, or bypass patterns.
Include:
- Site name
- Environment
- Time range selected
- Affected URL or path, if applicable
- Screenshot of the chart or table
- Any recent cache, plugin, theme, deployment, DNS, or origin changes
Where to go next
After reviewing Cache analytics, continue with the related cache or performance task.
- Adjust cache behavior from Cache management.
- Create path or cookie exceptions with Cache URL and cookie exclusions.
- Compare cache results against overall site metrics in Performance overview.
- Check detailed timing data in Performance analytics.
- Investigate unexpected cache behavior with Cache not working.
Was this article helpful?