

Review Performance Analytics
The Performance Analytics page shows request volume and response timing data for your site.
Use this page to review traffic patterns, compare request and response timings, identify high-impact paths, and drill down into specific hours that may affect your site’s performance.
Access the Performance Analytics page
- Log in to the Pressidium Dashboard.
- Select the site you want to manage.
- Go to Performance -> Performance Analytics.
Sections Included
- Performance summary cards: Show requests per minute, average total request time, and average server response time.
- Requests Per Minute chart: Shows request volume over time, grouped by HTTP method.
- Request / Response Timings chart: Shows average timing trends over the selected period.
- Top Paths – Drill Down table: Lists the paths with the highest performance impact, based on request count and average response time.
This gives you a high-level view of site performance and a detailed view of the URLs contributing most to request volume or response time.
Performance summary cards
The summary cards show key performance indicators for the selected time period.
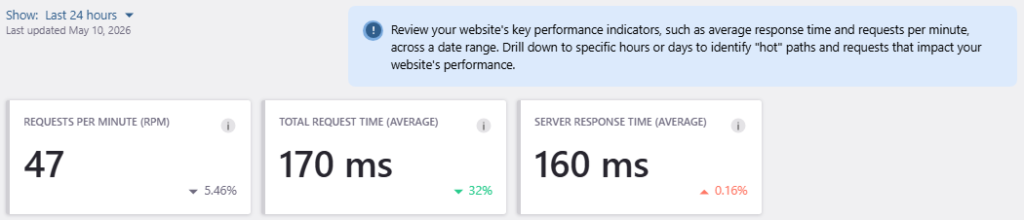
At the top of the page, use the Show filter to change the reporting period.
You can select:
- Last 24 hours
- Last 7 days
The page shows when the data was last updated below the selected time range.
The cards include:
- Requests per minute (RPM): The average number of requests per minute.
- Total request time (average): The average total time for a request over the selected period. This includes the time taken by the client to read the response.
- Server response time (average): The average time for the server to generate a response over the selected period. This includes PHP and database processing time.
Use these cards to quickly understand whether request volume or response timing has changed during the selected period.
Requests Per Minute chart
The Requests Per Minute chart shows average request volume over time.
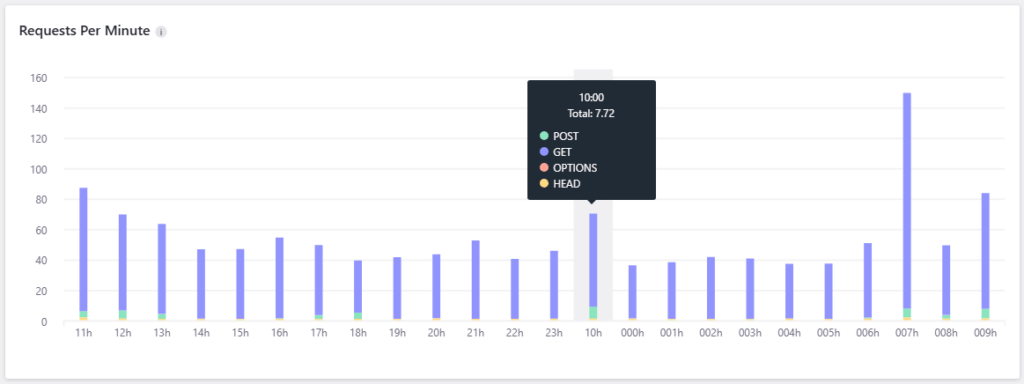
Requests are grouped by HTTP method, such as:
- GET
- HEAD
- POST
Hover over a point or bar to view the total request count for that time and the breakdown by HTTP method.
Use this chart to identify traffic spikes, unusual request patterns, or periods with increased activity.
Request / Response Timings chart
The Request / Response Timings chart shows average timing trends over time.
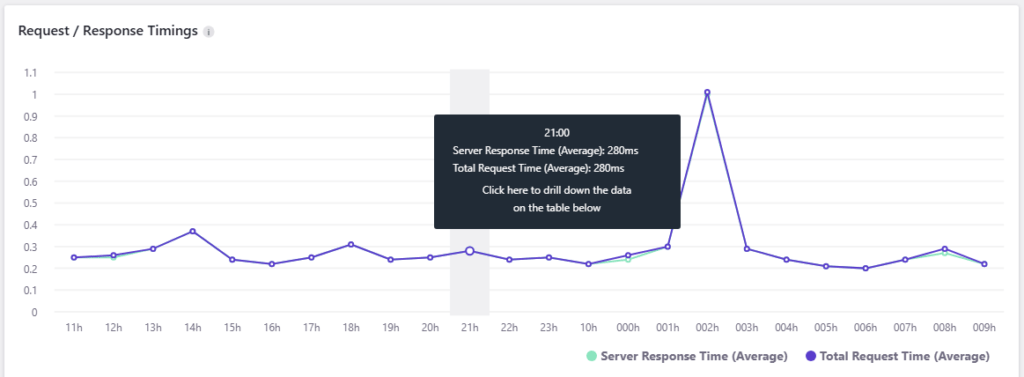
It includes:
- Server Response Time (Average): The average time spent generating the server response.
- Total Request Time (Average): The average total request time, including client-side response read time.
Hover over a point to view the timing values for a specific hour.
Click a point in the chart to drill down into that time period. The Top Paths – Drill Down table updates to show the paths that contributed to the selected hour.
Top Paths – Drill Down table
The Top Paths – Drill Down table shows top path performance based on total number of requests and average response time.
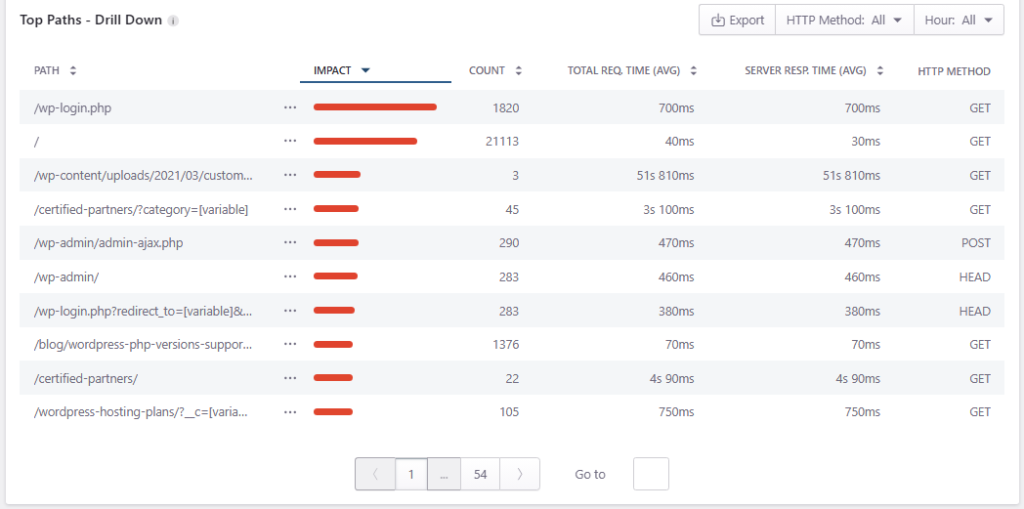
For each path, the table shows:
- Path: The requested URL path.
- Impact: A visual indicator of the path’s relative performance impact.
- Count: The number of requests recorded for the path.
- Total Req. Time (Avg): The average total request time.
- Server Resp. Time (Avg): The average server response time.
- HTTP Method: The request method, such as GET, HEAD, or POST.
Use this table to identify paths that receive high traffic, take longer to respond, or combine both high request volume and slower response times.
Filter the drill-down table
Use the filters above the table to narrow the results.
The HTTP Method filter lets you view:
- All
- GET
- HEAD
- POST
The Hour filter lets you view all hours or focus on a specific hour. Use the search field inside the dropdown to find a specific hour faster.
Click Export to download the table data as a CSV file.
Copy a path
In the Top Paths – Drill Down table, click the row actions menu next to a path.

Click Copy to clipboard to copy the path value.
Use this when you need to share a specific URL path with your team or include it in a support request.
Understanding the results
Use Performance Analytics to identify traffic and timing patterns across your site.
A high request count does not always indicate a problem. Popular pages, static assets, bots, scheduled tasks, and third-party integrations can all increase request volume.
A high server response time usually deserves closer review, especially when it appears on dynamic WordPress paths such as login, admin AJAX, WooCommerce, membership, LMS, or search-related URLs.
A high total request time with a lower server response time may indicate that the server responded quickly, but the full response took longer to complete from the client side.
Note: Performance analytics help you identify where to investigate. They do not replace application-level debugging for slow PHP, database queries, plugins, themes, or external API calls.
Best practices
Review the same time range when comparing before-and-after results.
Use the Requests Per Minute chart to identify traffic spikes before reviewing slower paths.
Use the Request / Response Timings chart to find hours with slower average response times.
Click a timing point before reviewing the Top Paths – Drill Down table. This helps you focus on the paths that contributed to that specific period.
Compare request method types. For example, frequent POST requests may point to dynamic actions such as forms, checkout flows, admin AJAX, or API activity.
Export the drill-down table when you need to share performance data with a developer, client, or Support.
Common questions
What does “Server Response Time” stand for?
It’s the total processing time (in milliseconds) of a single request. It includes time taken by PHP to process the request as well as any time spent in network, database or filesystem I/O operations.
What is the difference between “Total Request Time” and “Server Response Time”?
Total Request Time includes the server response time and the time taken by the client (browser etc.) to read the response. A client/user with a slow or bandwidth limited connection may result in increased Request Time(s).
What does “Impact” (Performance) stand for?
“Impact” is a calculated relative metric that takes into account the total number of requests for a specific path / URL and the average server response time for this resource in the selected time window. It can be used to identity specific requests that may potentially affect performance or compare performance characteristics of one or more requests:
- A path / URL with a small request count may have a large impact because of a high average response time (e.g. a lengthy bulk action process).
- A path / URL with a small average response time may have a large impact due to a high number of requests. (e.g a WordPress REST API call).
Need help?
Contact Support if:
- Server response time remains consistently high.
- A path shows an unexpected increase in traffic or response time.
- You cannot identify the source of frequent dynamic requests.
- The analytics data appears incomplete or incorrect.
- You need help interpreting an exported report.
Include:
- The affected domain
- The selected environment
- The reporting time range
- The relevant hour
- The affected paths
- The HTTP methods
- The displayed request and response timings
- The approximate timestamp and timezone
- Screenshots or the exported CSV file
- Any recent site, plugin, theme, or traffic changes
Where to go next
After reviewing Performance analytics, continue with the related performance, cache, or troubleshooting area.
- Return to the main performance summary in Performance overview.
- Check cache handling in Cache analytics.
- Tune cache settings from Cache management.
- Compare analytics with audit findings in Site audit.
- Investigate performance drops with Performance degradation.
Was this article helpful?