

Analyze traffic patterns and request sources
The Traffic Analytics page helps you understand how requests move through Pressidium EDGE for a selected site and environment.
Use this screen when you need to:
- Check how much traffic your site is receiving through EDGE
- Review how many requests are served from cache
- Identify URLs with the highest request volume
- Investigate traffic by country, IP address, or referrer
- Review HTTP response patterns and cache status where available
- Export traffic data for further review
Prerequisites
Before using this page, make sure you have:
- Access to the Pressidium Dashboard
- Access to the site and environment you want to review
- The correct environment selected, especially when comparing Production and Staging traffic
- Traffic already flowing through Pressidium EDGE
Access the Traffic Analytics page
- Log in to the Pressidium Dashboard.
- Go to Websites and select the site you want to manage.
- Then go to Traffic -> Traffic Analytics.
Included sections
- Date range and Summary cards
- Total Requests chart to review request activity
- Response Breakdown that shows how requests were handled
- Top URLs by highest request volume
- Top Countries section
- Top IPs by highest request volume
- Top Referrers table to see where traffic is coming from
Date range and Summary cards
Use the Date Range selector to choose the reporting period you want to review.
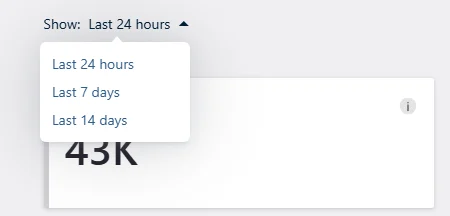
Changing the date range updates the summary cards, charts, response breakdown, and traffic tables shown on the page.

Pageviews
Shows the total number of pageview requests recorded for the selected period.
Use this number to understand how many page-level requests your site received through EDGE.
Static Assets Requests
Shows the number of static asset requests, such as images, CSS files, JavaScript files, and other static resources.
Use this card to understand how much of your traffic comes from assets rather than page requests.
Data Served on EDGE
Shows how much traffic was served by EDGE instead of being handled directly by the origin.
A higher percentage usually means EDGE is reducing origin load effectively.
Total Requests chart
The Total Requests chart helps you review request activity over time.
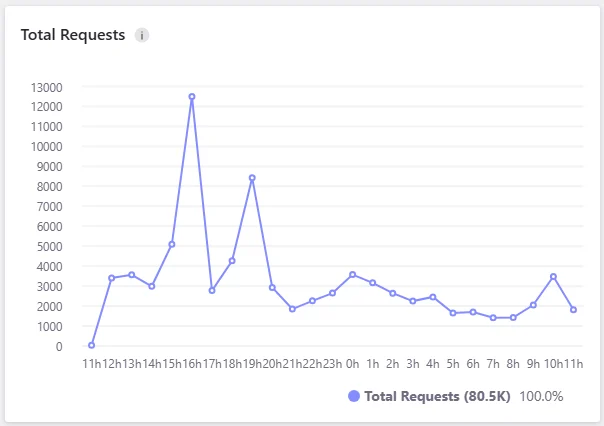
Use this chart to spot:
- Traffic increases or drops
- Unusual request spikes
- Changes after a deployment, campaign, or cache rule change
The chart shows request volume over time so you can compare traffic patterns across the selected period.
Response Breakdown
The Response Breakdown section shows how requests are distributed by HTTP response status.
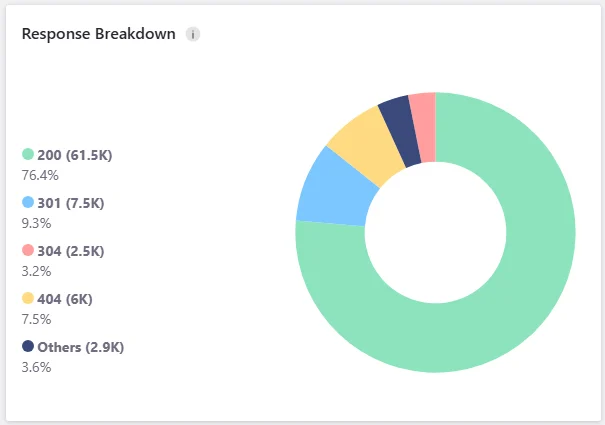
Common response types include:
- 200: Successful requests.
- 301: Permanent redirects.
- 304: Not modified responses.
- 404: Requests for pages or files that were not found.
- Others: Additional response codes grouped together.
Use this section to understand whether most traffic is returning successful responses, redirects, not modified responses, or errors.
If 404s or other unexpected responses are higher than expected, review the affected URLs, recent redirects, deployments, and traffic sources.
Top URLs
The Top URLs table lists the URLs with the highest request volume.
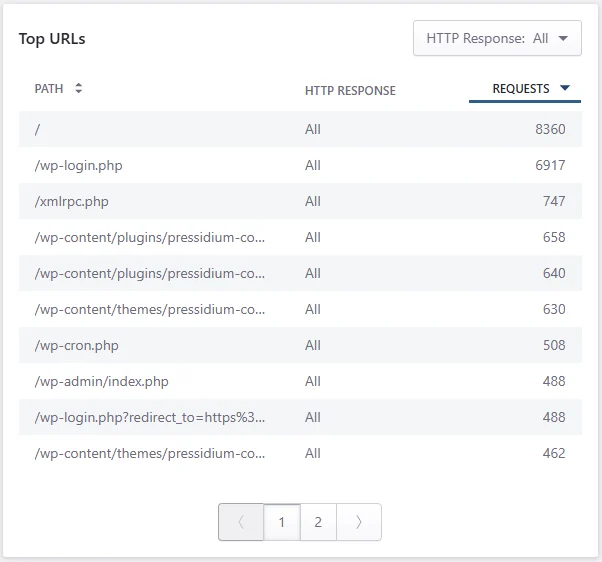
Use this table to identify:
- Popular pages and paths
- Frequently requested WordPress endpoints
- URLs with high request volume
- URLs returning specific HTTP response codes
- Paths that may need closer review
You can filter the table by HTTP response type and export the data for further analysis.
Top Countries
The Top Countries section shows where requests are coming from.
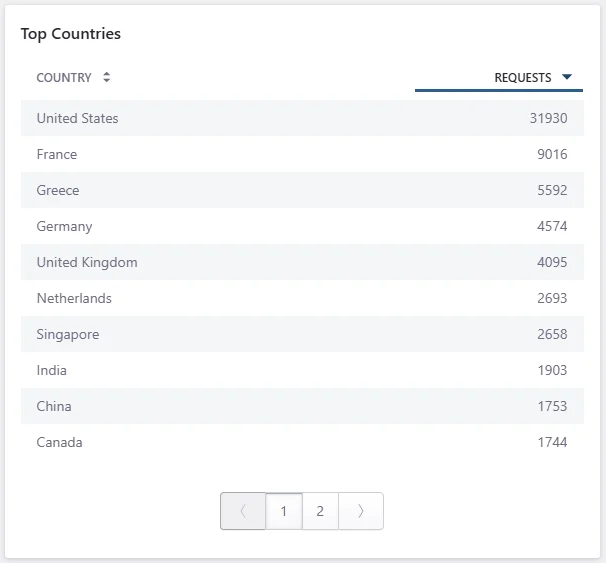
Use this section to identify:
- Your most active visitor regions
- Unexpected traffic from specific countries
- Regional traffic patterns
- Countries that may need closer security review
If a country generates suspicious traffic, review your firewall rules and security events before blocking traffic.
Top IPs
The Top IPs table lists IP addresses with the highest request volume.
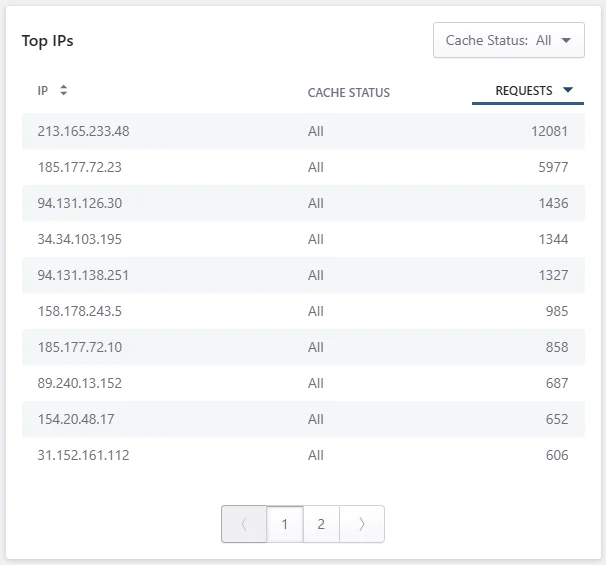
Use this section to investigate:
- Heavy crawlers
- Suspicious traffic
- Repeated requests from the same source
- Possible bot or abuse patterns
Top Referrers
The Top Referrers table shows where traffic is coming from.
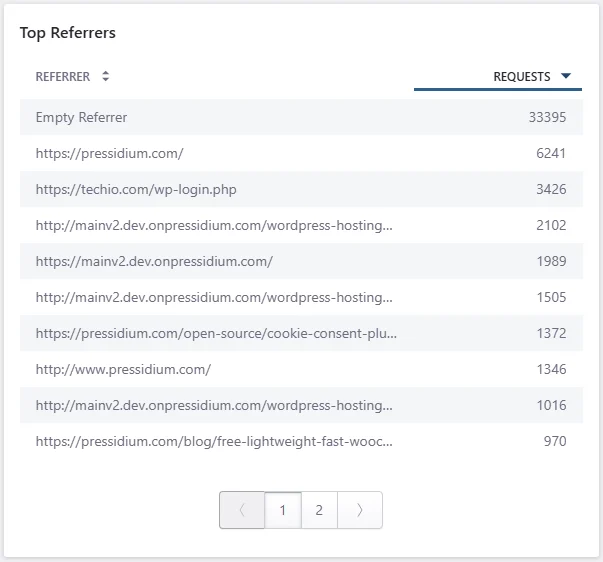
Use this section to identify:
- Search engines
- Campaign sources
- Partner links
- Unexpected referrers
- Potential spam referrers
This can help you connect traffic patterns with marketing campaigns, external links, or suspicious sources.
Export analytics data
Some analytics tables include an Export option.
Use export when you need to:
- Share traffic data with your team
- Compare data outside the dashboard
- Investigate unusual traffic patterns
- Provide supporting information to Support
Common questions
Why do I see uncached requests?
Some requests are not suitable for cache. This can happen when requests include specific cookies, logged-in sessions, dynamic behavior, query strings, or cache-bypass rules.
Why do some requests bypass cache?
Requests can bypass cache because of configured rules, cookies, request paths, or WordPress behavior that should not be cached.
Why are static asset requests higher than pageview requests?
A single pageview can trigger many asset requests. Images, CSS files, JavaScript files, fonts, and other files are counted separately as static asset requests.
Can I use Traffic Analytics to detect attacks?
Traffic Analytics can help identify unusual request patterns, top IPs, suspicious referrers, or country-level spikes. For security-specific investigation, also review Security Events Analytics.
Common issues and solutions
Traffic looks lower than expected
Check that:
- The correct site is selected.
- The correct environment is selected.
- The date range is correct.
- DNS is pointing traffic through Pressidium EDGE.
- The domain is active and receiving traffic.
Cache hit levels look lower than expected
Check whether:
- Many requests include cookies.
- Important URLs are excluded from cache.
- Custom web rules are bypassing cache.
- Logged-in or dynamic requests are included in the selected data.
- Recent cache purges affected the selected period.
A URL shows many cache misses
Review the URL and check whether it includes query strings, cookies, custom cache rules, or dynamic behavior that prevents caching.
A country or IP shows unusual traffic
Review the related URLs, response types, and security events. If the traffic appears abusive, consider creating a firewall rule or contacting Support.
Best practices
Review Traffic Analytics after major changes, such as DNS updates, cache rule changes, plugin changes, launches, campaigns, or deployments.
Use Response Breakdown to review HTTP status patterns before investigating redirects, missing URLs, or unexpected errors.
Compare traffic data with Security Events Analytics when investigating suspicious spikes.
Export data before making major rule changes so you have a baseline for comparison.
Need help?
Contact Support if:
- Traffic does not appear after DNS has been configured
- Analytics data looks incorrect for the selected date range
- You see unexpected error spikes
- A large amount of traffic is bypassing cache and you are not sure why
- You need help investigating suspicious IPs, countries, URLs, or referrers
Include the site name, environment, date range, affected URLs, screenshots, and any relevant timestamps.
Where to go next
After reviewing Traffic analytics, use the related pages to compare request patterns with performance, cache, and security activity.
- Return to the summary view in Traffic at a glance.
- Compare traffic trends with cache outcomes in Cache analytics.
- Check response timing and delivery metrics from Performance analytics.
- Review suspicious or blocked traffic in Events analytics.
- Inspect individual request details from Access logs.
- Control traffic by country with Block or allow traffic by country.
Was this article helpful?