
Security at a Glance
Security at a Glance is the main security overview page for a site in Pressidium EDGE. It brings together high-level security metrics, quick security controls, and threat distribution data so you can review recent security activity from one place.
When to use it
Use the Security at a Glance page when you want to:
- Check your site’s current security status
- Review recent threat activity
- Confirm Firewall and DDoS protections are enabled
- Identify vulnerable WordPress components
- Review bot-related activity
- Find patterns by rule, IP, or country
Access the Security at a Glance page
- Log in to the Pressidium Dashboard.
- Select the site you want to review.
- Select the correct environment.
- Go to Security.
- Open the At a Glance tab.
Sections included
- Security Score
- Threats Identified
- Vulnerabilities Found
- Bots Identified
- Quick Actions
- Threats by Rule ID
- Threats by IP
- Requests by Bots
- Threats by Country
Each section gives you a quick view of security activity and helps you decide where to investigate next.
Security summary
The security summary shows high-level security indicators for the selected period.
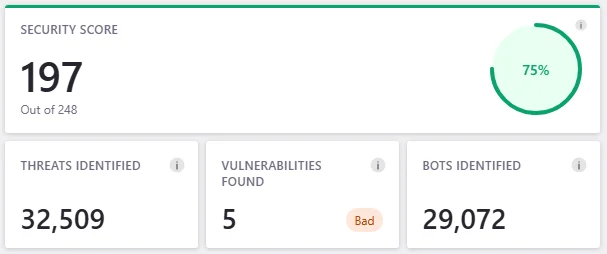
Use this section to review your current security score, detected threats, vulnerabilities, and bot activity.
- Security Score gives you a high-level indicator of your site’s current security status.
Use this score as a starting point, then review the related indicators below it. - Threats Identified shows detected threat activity for the selected period.
Use this metric to understand how much suspicious or malicious activity EDGE has identified. - Vulnerabilities Found shows detected vulnerabilities for the site.
Review vulnerabilities and update affected WordPress components when appropriate. - Bots Identified shows detected bot activity for the selected period.
Use this metric to understand whether automated traffic is interacting with your site.
Quick Actions
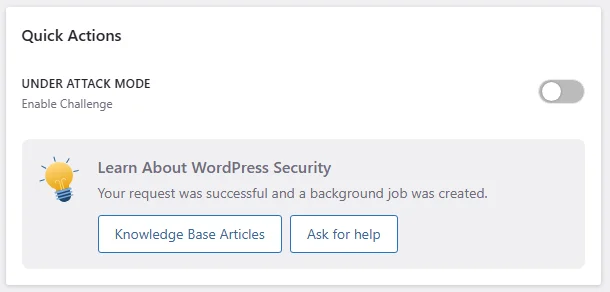
The Quick Actions card gives you access to common security controls.
Under Attack Mode
Use Under Attack Mode when your website is experiencing a high-volume attack that makes it slow or unavailable.
- Turn on Enable Challenge.
- Review the Enable Under Attack Mode confirmation dialog.
- Click Enable.
A background operation starts after you confirm the action. A notification appears in the sidebar when it is complete.
When enabled, visitors must pass a client-side challenge before accessing your website. They may briefly see an interstitial page while the challenge runs.
WordPress security resources
Use the available resources when you need more information or assistance:
- Click Ask for help to contact Support.
- Click Knowledge Base Articles to review WordPress security guidance.
Top Threats by Rule
The Threats by Rule ID chart shows how detected requests are distributed across rule outcomes or categories for the selected period.
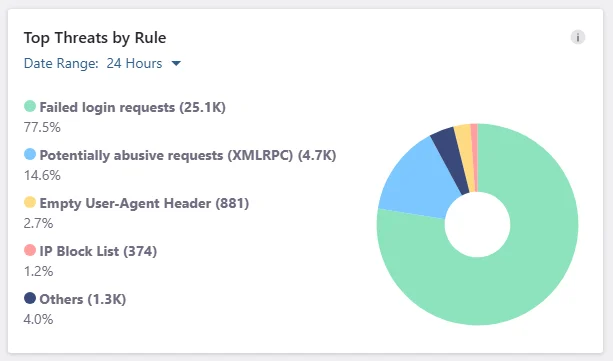
Use this section to understand which types of security rules are involved in recent activity.
Threats by Rule
The Threats by Rule table shows which firewall rules matched incoming requests during the selected period.
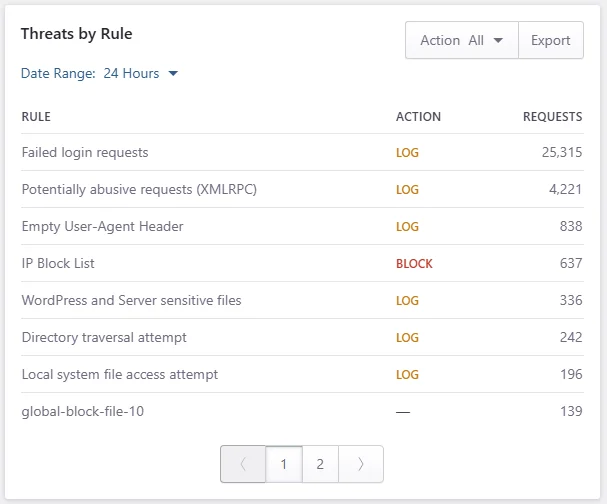
Use this table to identify the types of suspicious or unwanted traffic reaching your website and see how the firewall handled each match.
For each rule, the table shows:
- Rule – the firewall rule or protection category that matched the request
- Action – the action applied to matching requests
- Requests – the number of requests that matched the rule
Actions may include:
- LOG – the request was recorded for visibility but was not blocked by this rule
- BLOCK – the request was blocked
- — – no action value is displayed for the rule
Use the Date Range selector to change the reporting period.
Use the Action filter to narrow the table by the action applied:
- All – shows every rule
- Log – shows rules that record matching requests without blocking them
- Block – shows rules that block matching requests
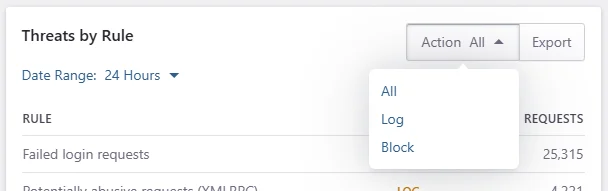
Click Export to download the table data as a CSV file.
Threats by IP
The Threats by IP table shows which source IP addresses generated requests that matched firewall rules during the selected period.
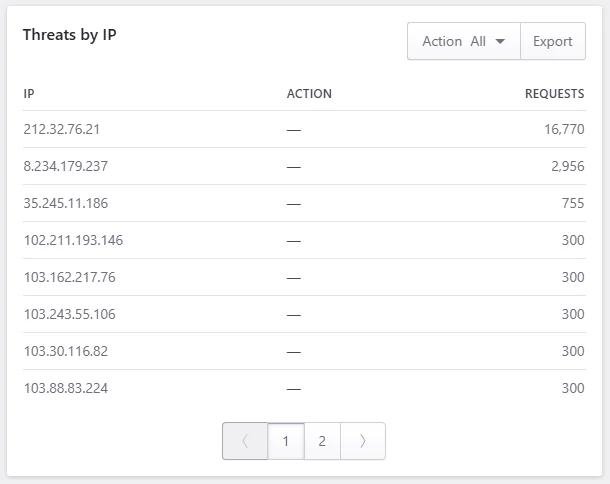
Use this table to identify high-volume sources, investigate repeated suspicious activity, and see how the firewall handled requests from each IP address.
For each entry, the table shows:
- IP – the source IP address associated with the requests
- Action – the action applied to matching requests
- Requests – the number of matching requests associated with the IP address
Actions may include:
- LOG – matching requests were recorded but not blocked by the related rule
- BLOCK – matching requests were blocked
- — – no action value is displayed for the IP address
Use the Action filter to narrow the table by the action applied:
- All – shows every listed IP address
- Log – shows IP addresses associated with logged requests
- Block – shows IP addresses associated with blocked requests
Click Export to download the table data as a CSV file.
Request by Bots
The Request by Bots table shows the user agents associated with automated requests during the selected period.
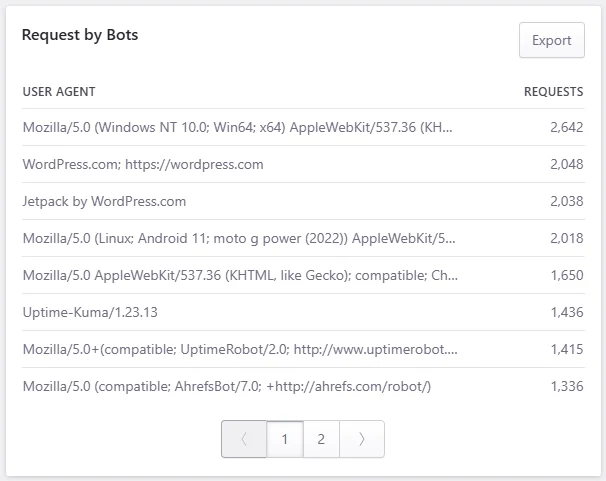
Use this table to identify crawlers, monitoring services, SEO tools, WordPress services, and other automated clients generating requests to your website.
For each entry, the table shows:
- User Agent – the identifier sent by the requesting browser, crawler, bot, or service
- Requests – the number of requests associated with that user agent
Common entries may include:
- Search-engine crawlers
- Uptime and monitoring services
- WordPress.com and Jetpack services
- SEO and site-audit tools
- Browser-like or custom automated clients
Click Export to download the table data as a CSV file.
Threats by Country
The Threats by Country map shows where detected threats are coming from geographically.
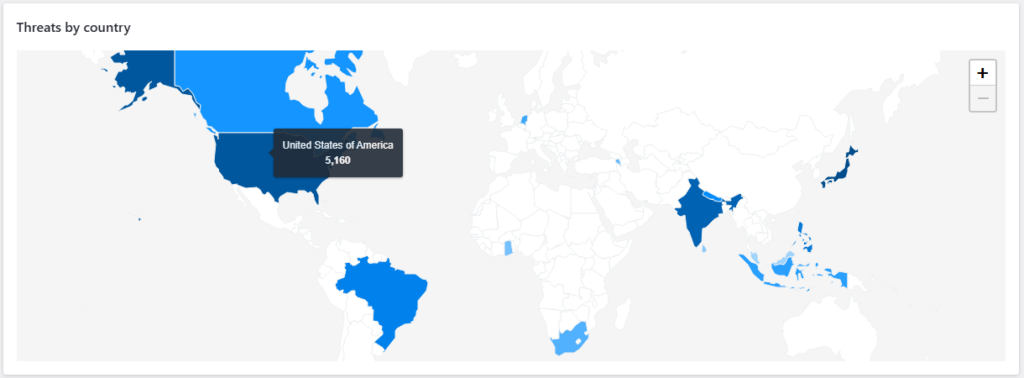
Use this section to review regional patterns in suspicious or blocked traffic.
Need help?
If security activity looks unusual or you are unsure how to respond, contact Support and include:
- Site name
- Domain
- Date range
- Screenshot of the Security at a Glance page
- Affected rule ID, IP, country, or bot details if available
- Any recent firewall, DNS, plugin, theme, or WordPress changes
Where to go next
From the Security overview page, continue with the security area you want to inspect or manage.
- Manage Firewall behavior from the Firewall page.
- Analyze blocked requests, rule matches, and suspicious activity in Events analytics.
- Review request volume and response outcomes in Traffic at a glance.
- Check recent request details from Access logs.
- Troubleshoot false positives with Site blocked by WAF.
Was this article helpful?