
WAF Events & Analytics
The Security Events & Analytics page helps you review security activity for a selected site in Pressidium EDGE.
Use this page to investigate blocked threats, identify repeated attack sources, review source countries and IPs, and inspect individual security events.
Access the Security Events & Analytics screen
- Log in to the Pressidium Dashboard.
- Go to Websites.
- Select the site you want to review.
- Go to Firewall > Events & Analytics.
Included sections
- Date Range: Lets you select the reporting period.
- Threats Blocked: Shows activity over the selected date range.
- Top Countries by Identified Threats: Groups identified threats by country.
- Top IPs by Identified Threats: Shows the IP addresses associated with identified threats.
- All Events: Lists individual security events.
Date Range
Use Date Range to select the period you want to review.
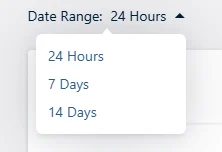
The selected date range affects the charts and tables on the page.
Use a shorter range when you are investigating a recent issue. Use a longer range when you want to identify patterns over time.
Threats Blocked
The Threats Blocked chart shows activity over the selected date range.
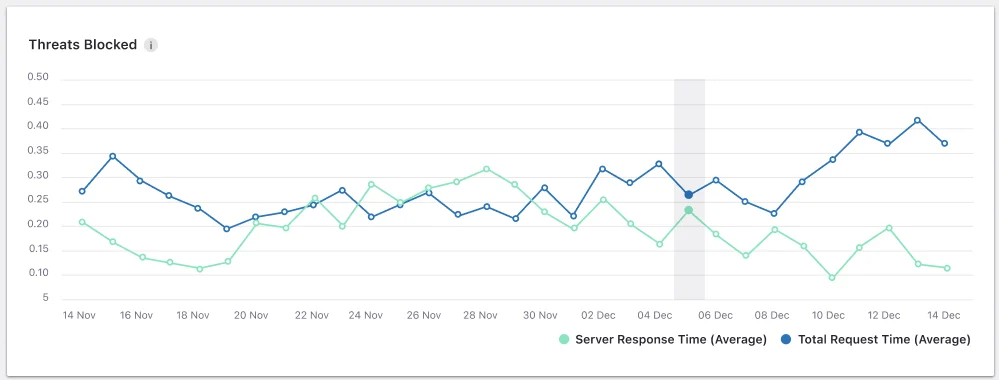
Use this chart to spot spikes or unusual changes that may need further review in the tables below.
Top Countries by Identified Threats
The Top Countries by Identified Threats table groups identified threat activity by source country.
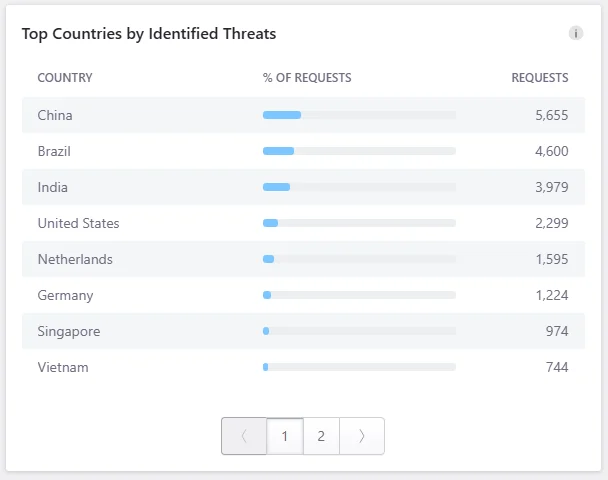
The table includes:
- Country
- % of Requests
- Requests
Use it to review whether security events are concentrated in specific locations.
Top IPs by Identified Threats
This table shows the IP addresses associated with identified threat activity.
It helps you find repeated source IPs and review high-volume suspicious activity.
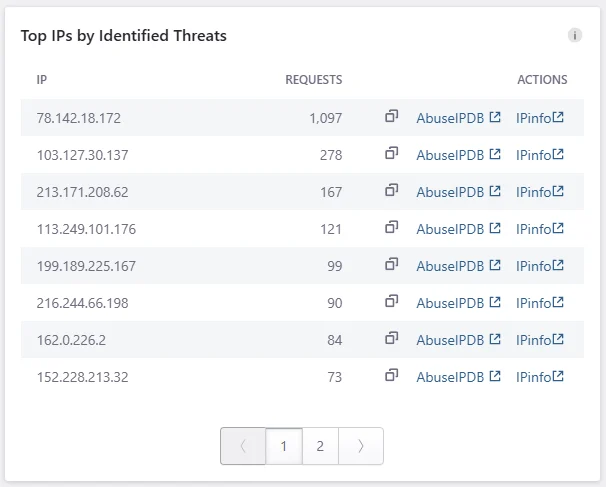
It includes:
- IP
- Requests
- Actions
Use the action links to review the IP address in external reputation tools such as AbuseIPDB or IPinfo.
All Events
The All Events table lists individual security events recorded for the selected date range.
Here you can inspect event-level details instead of summary charts.
The table includes:
- Rule: The security rule or event type.
- Action: The action recorded for the event.
- Source IP: The IP address associated with the request.
- Source Country: The country associated with the request.
- Source User Agent: The user agent associated with the request.
- Path: The requested path involved in the event.
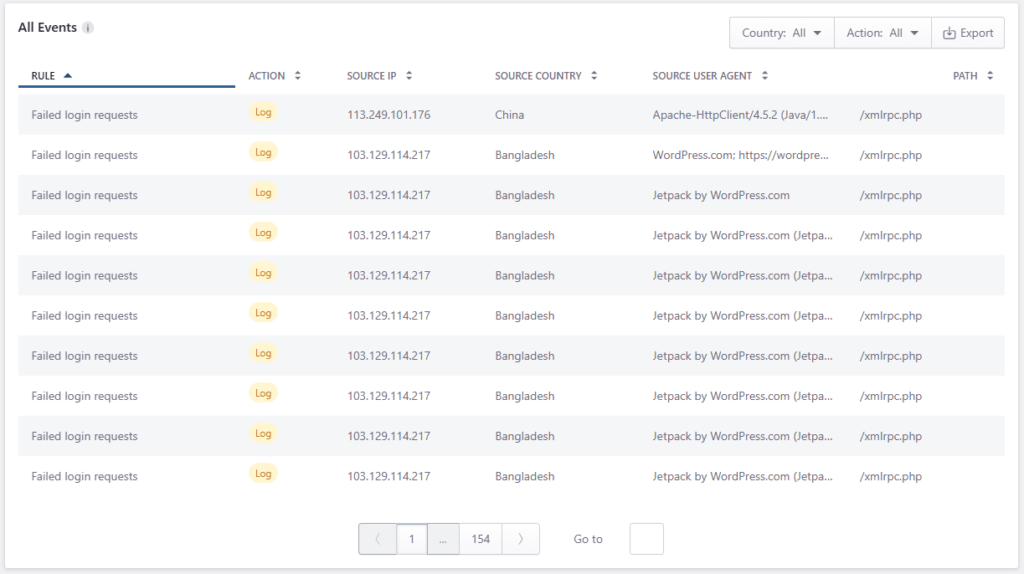
Use the Country and Action filters to narrow the table, or click Export to download the event data in a CSV format.
Common issues and solutions
A blocked source still appears after creating a rule
Security analytics may include historical events from before the rule was created.
Check the event timestamp and selected date range before assuming the rule is not working.
The table does not show the event you expected
Confirm that the selected date range includes the time of the event.
Also check any active filters, such as Country or Action, because filters can hide matching rows.
A spike appears in the chart
Review the related tables below the chart.
Start with Top IPs by Identified Threats, then check Top Countries by Identified Threats to understand whether the activity is concentrated around specific sources or locations.
Need help?
If security activity looks unusual or you are unsure how to respond, contact Support and include:
- Site name
- Domain
- Environment
- Date range
- Screenshot of the Security Events & Analytics page
- Source IP, country, user agent, or path if available
- Any recent Firewall, Security Rules, DNS, plugin, theme, or WordPress changes
Open a support request if you need help reviewing the activity.
Where to go next
After reviewing security events, continue with the page that helps you act on what you found.
- Adjust protection rules from the Firewall page.
- Return to the site-level security summary in Security overview.
- Compare event spikes with request volume in Traffic at a glance.
- Inspect individual request patterns in Access logs.
- Resolve cases where valid visitors are blocked with Site blocked by WAF.
Was this article helpful?