

Site Overview
The WordPress at a Glance page gives you a quick overview of a site’s WordPress installation, domains, SSL status, core settings, plugins, and themes.
Use this page when you need to check the general health of a WordPress site, review outdated software, confirm basic configuration, or navigate to common WordPress management actions.
Prerequisites
Before using this page, make sure you have:
- Access to the Pressidium Dashboard
- Access to the site and environment you want to review
- The correct environment selected, especially if you plan to make changes
Access the WordPress At a Glance page
- Log in to the Pressidium Dashboard.
- Select the site you want to manage.
- Select the correct environment.
- Go to Overview.
Summary
The Summary section shows basic information about the WordPress installation.
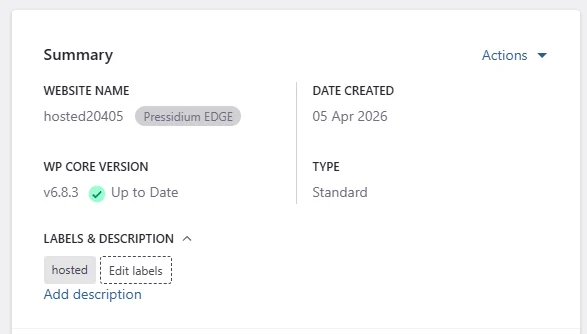
This may include:
- Website name
- Date created
- WordPress version
- Site type
- Labels and description
If a WordPress core update is available, the current version is shown with an Update available notice.
Labels and description
Labels help you organize sites inside the dashboard.
You can use labels to group websites by client, project, status, team, or workflow.
To update labels:
- Go to the Summary section.
- Click Edit labels.
- Add, remove, or change labels.
- Save your changes.
You can also add a short site description by clicking Add description.
Domains and SSL
The Domains and SSL section shows the site’s primary domain and SSL status.
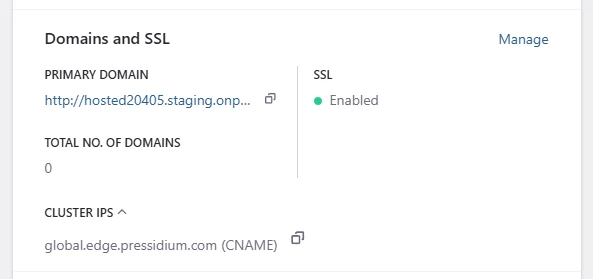
Use this section to confirm:
- The primary domain
- Whether SSL is enabled
- Whether force redirect to HTTPS is enabled
- The total number of domains
- Cluster IP information, where available
To manage domain or SSL settings, click Edit in the Domains and SSL section.
Settings
The Settings section shows important WordPress and access-related configuration values, such as:
- WP_DEBUG
- CDN
- WP_EDITOR
- SSH access
- Password protection
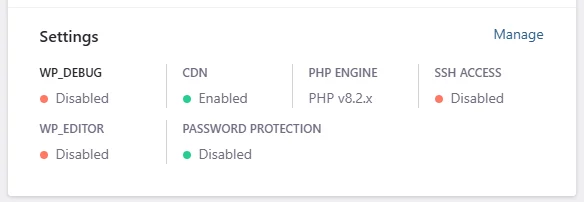
Each setting shows whether it is enabled or disabled.
To change these settings, click Edit in the Settings section.
Plugins overview
The Plugins section gives you a quick view of plugin status across the site.
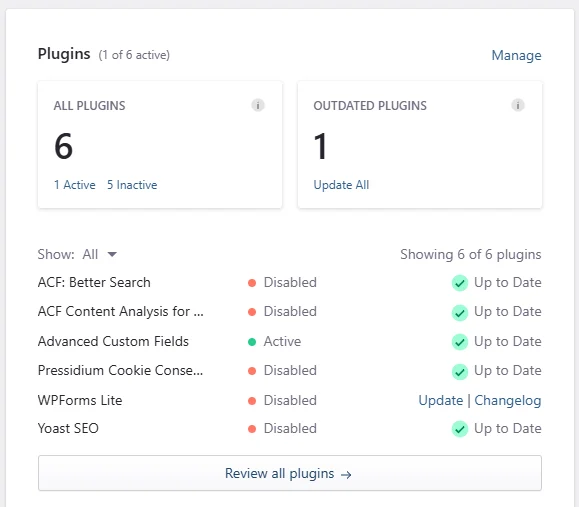
You can see:
- Total number of plugins
- Number of active and inactive plugins
- Number of outdated plugins
- Recently installed plugins
- Plugin status, such as active or disabled
- Available plugin updates
- Changelog links, where available
To manage plugins, click Manage Plugins.
Recently installed plugins
The Recently Installed Plugins list helps you identify recent changes to the WordPress installation.
For each listed plugin, the dashboard may show:
- Plugin name
- Active or disabled status
- Update availability
- Changelog link
Use this section when troubleshooting recent performance, compatibility, or behavior changes.
For example, if a site issue started after a recent plugin installation, review this list first.
Update a plugin
If a plugin update is available, the plugin row shows an Update action.
Before updating a plugin:
- Confirm you are in the correct environment.
- Review the plugin changelog, if available.
- Make sure you have a recent backup.
- Test the update in Staging when possible.
Themes overview
The Themes Overview section summarizes theme status for the site.
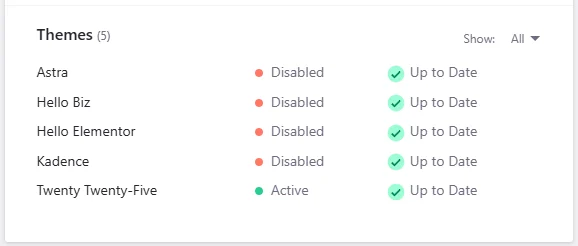
You can see:
- Total number of themes
- Number of active and inactive themes
- Number of outdated themes
To manage themes, click Manage Themes.
If all themes are up to date, the dashboard shows that no theme updates are required.
Last 3 months usage
The Last 3 months usage section shows recent resource usage for the site.
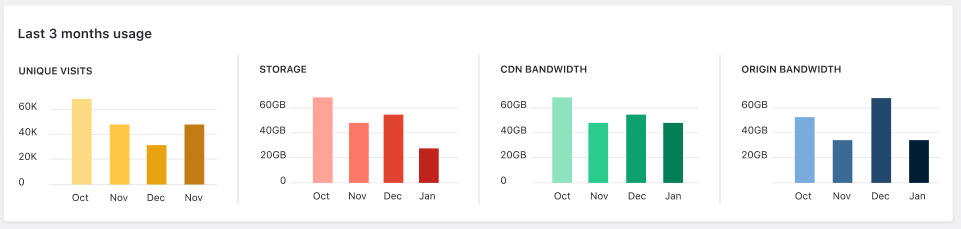
This may include:
- Unique visits
- Storage
- CDN bandwidth
- Origin bandwidth
Use this section to understand recent traffic and resource trends for the selected site.
For example, you can check whether visits increased, whether storage usage is growing, or whether CDN and origin bandwidth changed significantly during the last three months.
Higher CDN bandwidth usually means more content is being served through the edge layer. Higher origin bandwidth may indicate that more requests are reaching the origin instead of being served from cache.
If usage looks higher than expected, review recent site changes, traffic campaigns, plugin activity, and caching behavior.
Common issues and solutions
SSL appears disabled
Go to Domains and SSL and review the domain configuration. Confirm that the domain is correctly pointed and that SSL has been issued for the domain.
Site behavior changed recently
Review the Recently Installed Plugins list. A newly installed or updated plugin may have introduced the change.
A setting looks incorrect
Go to the relevant section and click Edit. If you are not sure what the setting controls, contact Support before changing it.
Usage looks higher than expected
Review the Last 3 months usage section to identify which metric increased.
If origin bandwidth increased, check whether caching behavior changed recently, whether new plugins were installed, or whether more traffic is bypassing cache.
If storage increased, review media uploads, backups, logs, or other large files added to the site.
Need help?
Contact Support if:
- A WordPress core, plugin, or theme update fails
- SSL remains disabled after configuration
- The dashboard shows unexpected status information
- You see errors after changing settings
- A plugin or theme issue affects the live site
Include the site name, environment, affected section, timestamp, and a screenshot of the issue.
Where to go next
- Open Domains to manage domain names, DNS status, and SSL.
- Open Settings to review and change website configuration.
- Open Plugins to manage plugin status, updates, and security issues.
- Open Themes to review and manage installed themes.
- Review Requests analytics to investigate website traffic and request activity.
- Create an Instant backup before making significant updates or configuration changes.
Was this article helpful?