
Site overview
The Site overview screen gives you a high-level summary of your site’s health, traffic, performance, security activity, and recent alerts in Pressidium EDGE.
Use the Overview dashboard when you want to:
- Check site health quickly
- Review recent alerts
- Confirm whether EDGE is serving traffic
- Compare cached and uncached performance
- Check whether the Firewall is active
- Decide which dashboard to open next
Access the Site overview screen
- Log in to the Pressidium Dashboard.
- Go to Websites.
- Select the site you want to manage.
Sections Included
- Site Details
- Site Health
- Quick Actions
- Alerts and Notifications
- Traffic summary
- Performance summary
- Security summary
Site Details
The Site Details section shows the website URL, labels, and description associated with the site.
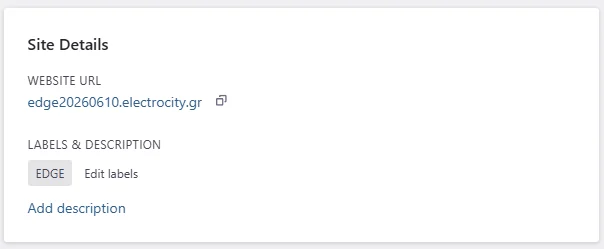
- Website URL shows the site’s current address. Click the URL to open the website, or click the copy icon to copy it.
- Labels & Description shows the labels assigned to the site. Click Edit labels to add, remove, or update them.
- Click Add description to add information that helps your team identify or manage the site.
Site health
The Site Health section gives you a summary of your website’s current performance, security, and WordPress health.
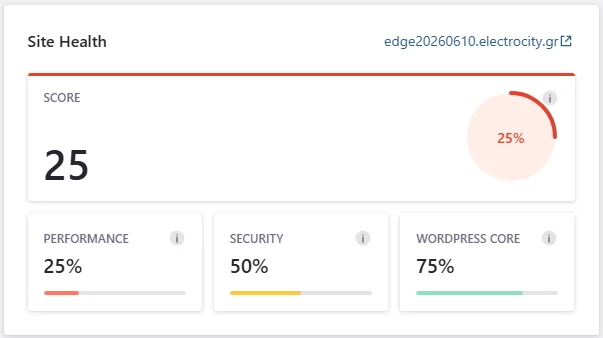
The domain shown at the top identifies the website being assessed. Click the domain to open the website in a new tab.
Overall score
Score shows the website’s overall health result on a scale from 0 to 100.
The circular indicator provides a visual representation of the current score. A higher score indicates that fewer issues were detected during the latest assessment.
Health categories
The overall result is divided into three categories:
- The Performance indicator reflects response time, cache hit ratio, and Core Web Vitals.
A lower value may indicate slower responses, reduced cache efficiency, or Core Web Vitals issues. - Security shows the result of checks related to website protection and security configuration.
To review security activity in more detail, click the Security tab. - The WordPress Score summarizes WordPress-related signals, such as plugin status, detected vulnerabilities, or other site-level checks.
Lower scores indicate areas that may require attention. Review the individual health checks before making changes, as each category may contain multiple recommendations.
Quick actions
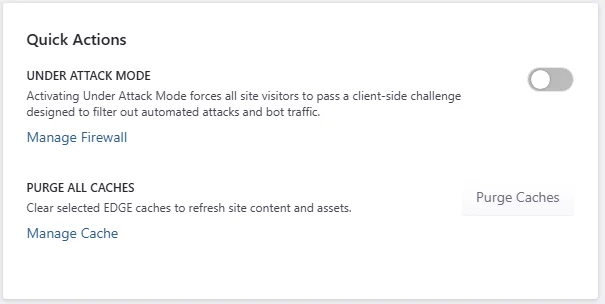
The Quick Actions section provides shortcuts for enabling additional attack protection and clearing cached site content.
Under Attack Mode
Use Under Attack Mode when a high-volume automated attack is making the site slow or unreachable.
Turn on the Under Attack Mode switch to open the confirmation dialog.
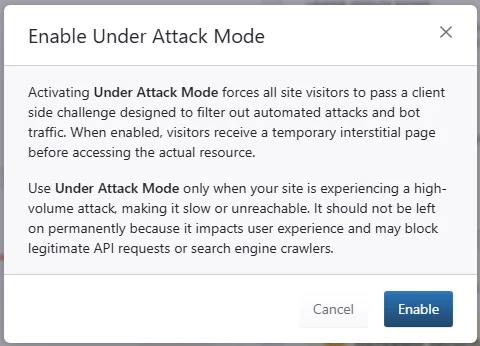
When enabled, visitors must pass a temporary client-side challenge before accessing the requested resource. This helps filter automated attacks and bot traffic before they reach the site.
Click Enable to activate Under Attack Mode, or Cancel to close the dialog without making changes.
Purge All Caches
Use Purge All Caches when recent changes are not visible or cached pages and assets are outdated.
Click Purge Caches to open the cache selection dialog.
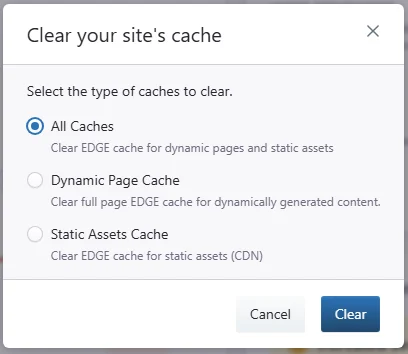
Select the cache type you want to clear:
- All Caches clears the dynamic page cache and static assets cache.
- Dynamic Page Cache clears cached pages generated dynamically by WordPress.
- Static Assets Cache clears cached static assets served through the EDGE CDN.
Click Clear to start the cache purge, or Cancel to close the dialog without clearing anything.
After the purge, EDGE fetches and caches updated content again as visitors request it.
Click Manage Cache to review cache settings or perform more targeted cache operations.
Alerts and Notifications
The Alerts and Notifications section highlights recent changes, detected issues, and recommended actions for the site.
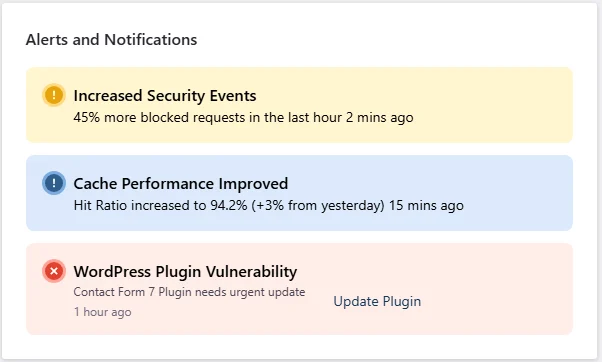
Notifications may include:
- Security alerts, such as an increase in blocked or malicious requests
- Performance updates, such as changes to the cache hit ratio
- WordPress alerts, such as vulnerable or outdated plugins
Each notification shows when the event was detected. Where an action is available, click the provided link or button to address the issue.
Traffic summary
The Traffic summary section shows recent request activity and how much traffic EDGE handled before it reached the origin.
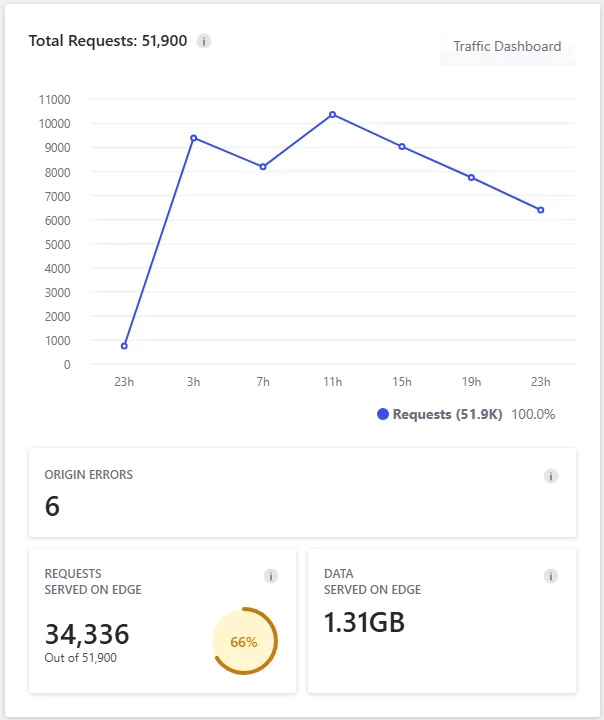
The chart shows the total number of requests over time. Use it to identify changes in traffic volume, including sudden increases or decreases.
The section also includes:
- Origin Errors shows the number of requests that resulted in an error from the origin.
- Requests Served on EDGE shows how many requests were served directly from EDGE, together with their percentage of total requests.
- Data Served on EDGE shows the amount of data delivered from EDGE during the reporting period.
A higher percentage of requests served on EDGE generally means fewer requests are reaching the origin.
Click Traffic Dashboard to review request activity, response codes, and high-traffic URLs in more detail.
Alerts and Notifications
The Alerts and Notifications section shows security issues, performance changes, maintenance updates, and other events that may require attention.
When no active issues or recommendations are detected, the section shows Everything looks healthy.
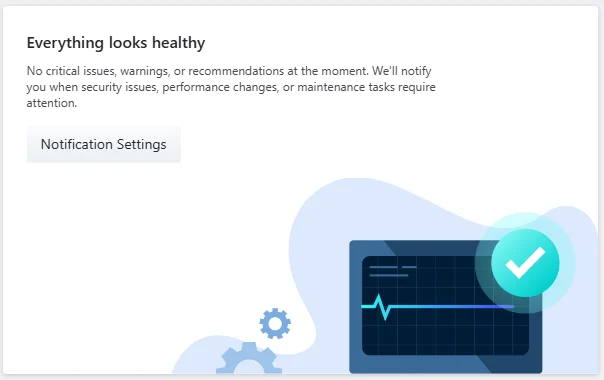
Pressidium will display new notifications here when relevant events are detected.
Notification settings
Click Notification Settings to review the availability of notification preferences.
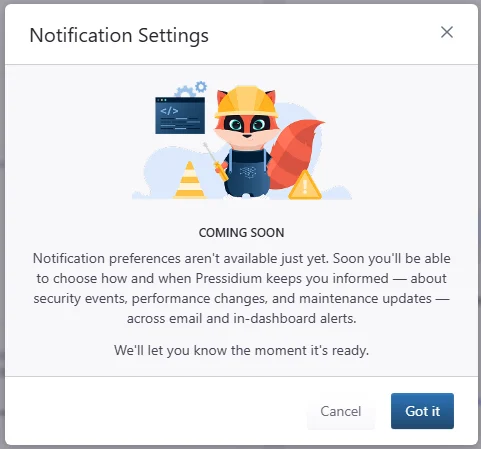
Notification preferences are not currently available. A future update will allow you to choose how you receive security, performance, and maintenance notifications through email and dashboard alerts.
Performance summary
The Performance summary section shows recent origin response times, cache effectiveness, and the site’s current performance score.
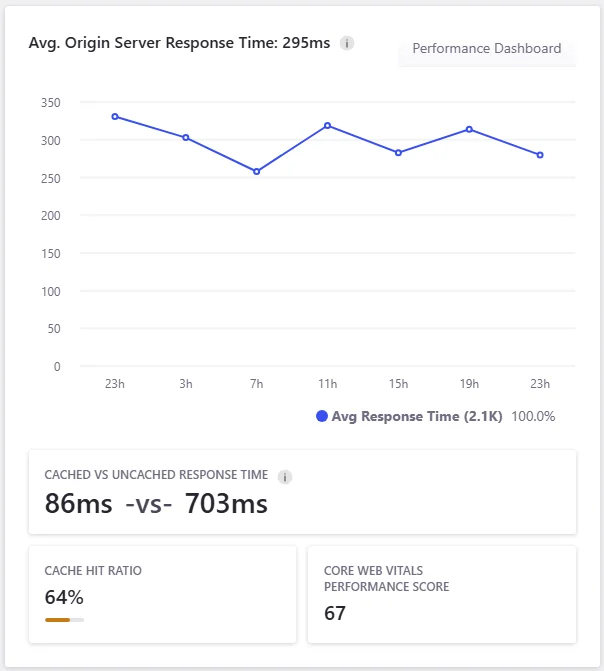
Avg. Origin Server Response Time shows how long the origin server takes to respond to requests that reach it. The chart shows how this value changes over the reporting period.
The section also includes:
- Cached vs Uncached Response Time compares requests served from EDGE cache with requests processed by the origin.
- Cache Hit Ratio shows the percentage of requests served from cache. A higher ratio generally means fewer requests are reaching the origin.
- Core Web Vitals Performance Score shows the site’s latest performance assessment.
Click Performance Dashboard to review performance analytics, cache behavior, and audit results in more detail.
Security summary
The Security summary section shows blocked malicious traffic, WAF status, and detected plugin vulnerabilities.
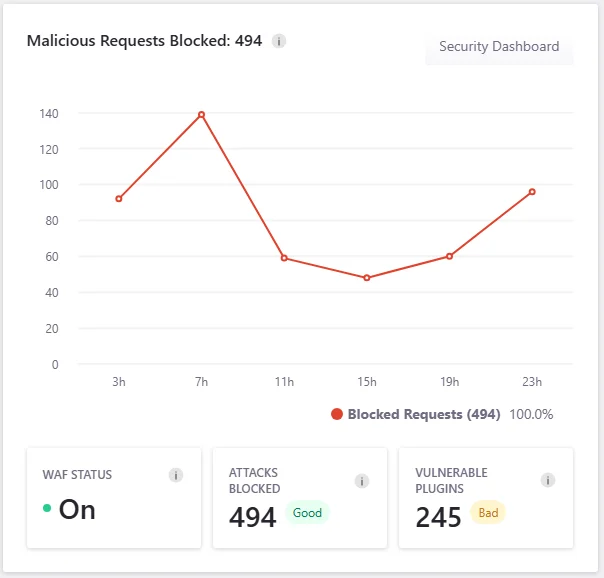
Malicious Requests Blocked shows the total number of requests blocked during the reporting period. The chart shows how blocked request activity changes over time.
The section also includes:
- WAF Status shows whether the Web Application Firewall is active.
- Attacks Blocked shows the total number of malicious requests stopped before reaching the origin.
- Vulnerable Plugins shows how many installed plugins have known security vulnerabilities.
Review vulnerable plugins promptly and update, replace, or remove them where appropriate.
Click Security Dashboard to review security events, firewall activity, and detected vulnerabilities in more detail.
Need help?
If the Overview dashboard shows unexpected values or repeated alerts, contact Support and include:
- Site name
- Domain
- Date and time of the issue
- Screenshot of the Overview dashboard
- Any recent DNS, cache, plugin, firewall, or origin changes
Where to go next
From the Site overview page, choose the area of the site you want to inspect next.
- Check the WordPress installation summary in WordPress overview.
- Explore request volume and response outcomes in Traffic at a glance.
- Investigate cache, speed, and delivery metrics in Performance overview.
- Monitor Firewall status and security activity from Security overview.
- Confirm certificate status from the SSL certificates page.
- Use Access logs to inspect recent site requests.
Was this article helpful?