

WordPress at a glance
The WordPress At a Glance page gives you a summary of the site’s WordPress installation, domains, SSL status, settings, plugins, themes, and recent usage.
When to use
Use this page when you need to:
- review the general state of a website
- check WordPress, plugin, or theme update status
- confirm domain and SSL information
- review important settings
- navigate to common website-management areas
Access the WordPress At a Glance page
- Log in to the Pressidium Dashboard.
- Select the site you want to manage.
- Go to WordPress.
The page contains:
- Basic site details (see Summary)
- WordPress version status
- Labels and description
- Primary domain and SSL status
- Important WordPress settings
- Plugin status
- Recently installed plugins
- Theme status
Summary
The Summary section shows the website’s main WordPress, domain, SSL, and runtime details.
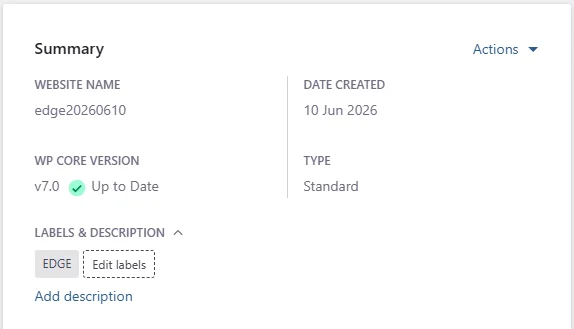
Website details
The top part of the section shows:
- Website name – the name used to identify the website in the Dashboard
- Date created – when the website was created
- WP Core Version – the installed WordPress version and whether it is up to date
- Type – the website type
- Labels & Description – labels and notes used to organize or identify the website
For detailed instructions on creating, editing, and managing labels, see Organize your websites with labels.
Descriptions can be added directly from the Summary section to provide additional context about the website.
Actions
Open Actions to access WordPress administration shortcuts.
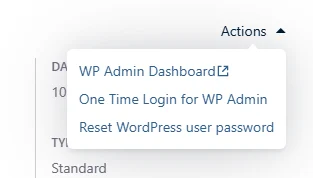
The menu includes:
- WP Admin Dashboard – opens the website’s WordPress administration dashboard in a new tab
- One Time Login for WP Admin – creates a one-time login session for accessing WP Admin
- Reset WordPress user password – opens the password reset process for a WordPress user
Domains and SSL
The Domains and SSL area shows:
- Primary domain – the main domain assigned to the website
- Total No. of Domains – the number of domains mapped to the website
- SSL – whether an SSL certificate is enabled
- Force Redirect to HTTPS – whether HTTP requests are automatically redirected to HTTPS
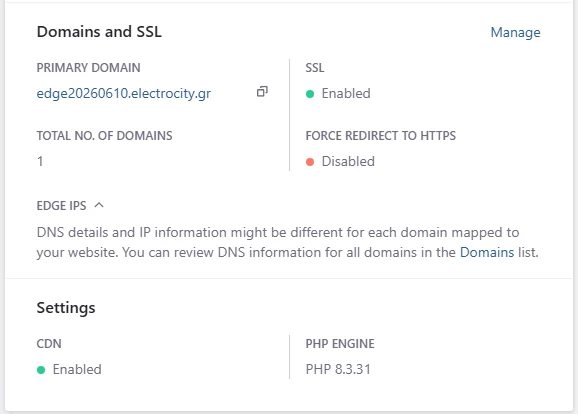
Click the copy icon beside the primary domain to copy it.
Expand EDGE IPs to review DNS and IP information. DNS details may differ between mapped domains, so use the Domains list to review each domain individually.
Click Manage to open the domain and SSL settings.
Settings
Settings
The Settings area shows the website’s current platform configuration, including:
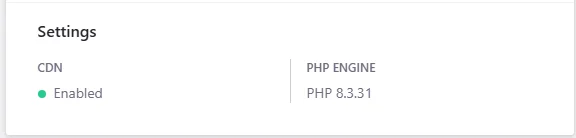
- CDN – whether CDN delivery is enabled
- PHP Engine – the PHP version currently used by the website
Review the Settings page to understand the available controls.
Plugins overview
The Plugins section summarizes the plugins installed on the website and highlights plugins that may require attention.
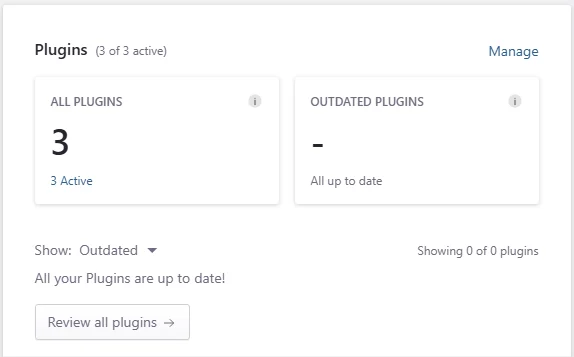
The section shows:
- All Plugins – the total number of installed plugins and how many are active
- Outdated Plugins – the number of plugins with an available update
Use the Show filter to display:
- All plugins
- Active plugins
- Disabled plugins
- Outdated plugins
- Plugins With Security issues
The plugin list updates according to the selected filter. When no plugins match the selected status, the section displays a confirmation message.
Click Manage or Review all plugins to open the full plugin list and manage installed plugins.
Themes overview
The Themes Overview section summarizes theme status for the site.
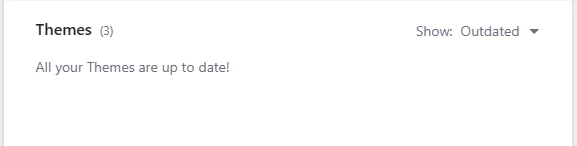
The section may show:
- total installed themes
- active and inactive themes
- outdated themes
If all themes are current, the Dashboard indicates that no updates are required.
Last 3 months usage
The Last 3 months usage section shows recent resource usage for the site.
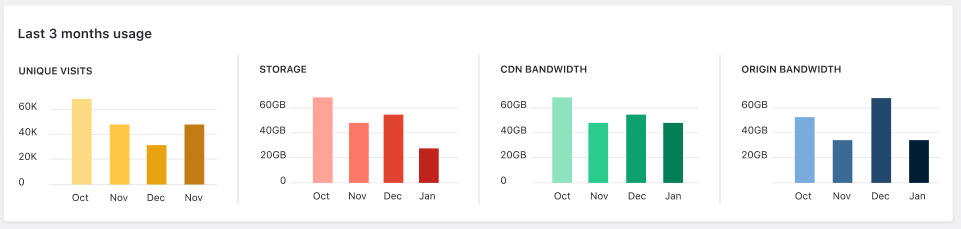
This may include:
- Unique visits
- Storage
- CDN bandwidth
- Origin bandwidth
Use this section to identify recent changes in traffic, storage, or bandwidth usage.
Higher CDN bandwidth generally means more content is being delivered through the edge layer. Higher origin bandwidth may indicate that more requests are reaching the origin rather than being served from cache.
For a more detailed investigation:
- Review website analytics to examine traffic and resource trends.
- Review cache analytics to compare cached and uncached requests.
- [Identify cache behavior using HTTP headers] to inspect individual responses.
- [Troubleshoot unexpected storage usage] when storage increases without an obvious cause.
- [Troubleshoot website performance] when increased usage is accompanied by slower responses.
Common issues and solutions
SSL appears disabled
Go to Domains and SSL and review the domain configuration. Confirm that the domain is correctly pointed and that SSL has been issued for the domain.
Site behavior changed recently
Review the Recently Installed Plugins list. A newly installed or updated plugin may have introduced the change.
A setting looks incorrect
Go to the relevant section and click Edit. If you are not sure what the setting controls, contact Support before changing it.
Usage looks higher than expected
Review the Last 3 months usage section to identify which metric increased.
If origin bandwidth increased, check whether caching behavior changed recently, whether new plugins were installed, or whether more traffic is bypassing cache.
If storage increased, review media uploads, backups, logs, or other large files added to the site.
Need help?
Contact Support if:
- A WordPress core, plugin, or theme update fails
- SSL remains disabled after configuration
- The dashboard shows unexpected status information
- You see errors after changing settings
- A plugin or theme issue affects the live site
Include the site name, environment, affected section, timestamp, and a screenshot of the issue.
Where to go next
From the WordPress overview page, open the WordPress area you want to manage.
Was this article helpful?